
Cross-Asset Volatility Divergence and Factor Realignment
Assessing geopolitical supply frictions, industrial cost pressures, and earnings dispersion across asset classes.
Global capital markets are witnessing a distinct decoupling between headline equity volatility and underlying cross-asset risk surfaces. While index-level equity measures remain comparatively subdued, stress is concentrating within fixed income and energy derivatives, underpinned by physical supply chain bottlenecks and macroeconomic uncertainty.
Macro Input Inflation and Industrial Cost Dislocation
Industrial manufacturing and capital-intensive sectors are absorbing escalating margin compression driven by triple-factor cost accretion: tariffs, elevated diesel benchmarks, and persistent semiconductor pricing power. Automotive original equipment manufacturers (OEMs) represent the focal transmission channel of these frictions. As component bottlenecks intersect with trade barriers, inventory carrying costs expand, dampening operating cash flow conversion.
Simultaneously, the geopolitical risk premium in commodity markets has resurfaced following targeted infrastructure disruptions in the Middle East, notably against primary refining nodes. This dynamic introduces non-linear upside convexity into energy derivatives, reinforcing inflationary friction throughout global industrial supply chains.
Cross-Asset Implied Volatility Stress Gauges
Volatility Term Structure and Cross-Asset Transmission
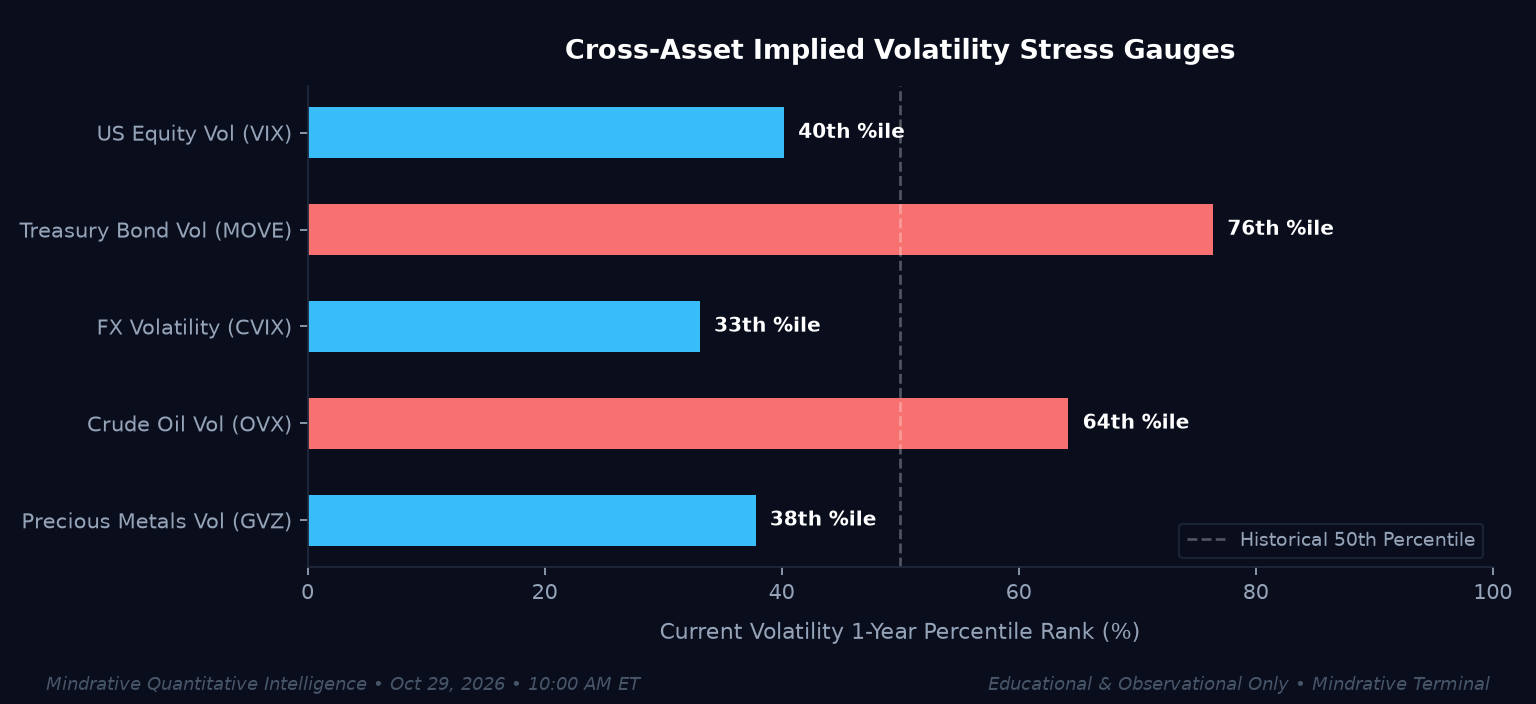
A granular inspection of cross-asset volatility percentiles highlights the structural divergence between equity index stability and macro factor stress. As demonstrated in our tracking monitors:
- Treasury Bond Volatility (MOVE at 76th percentile): Duration pricing continues to experience elevated volatility, reflecting ongoing term premium recalibration and monetary policy path dispersion.
- Crude Oil Volatility (OVX at 64th percentile): Energy volatility commands a marked premium above its historical median, reflecting supply asymmetry and heightened geopolitical sensitivity.
- US Equity Volatility (VIX at 40th percentile) & FX Volatility (CVIX at 33rd percentile): Surface-level equity and currency metrics remain anchored below median historical percentiles, masking significant intra-market rotational velocity.
Intra-Sector Dispersion and Balance Sheet Selectivity
Beneath quiescent broad market volatility indicators lies pronounced single-stock dispersion. Corporate earnings reports illustrate stark fundamental bifurcation. Enterprise software and ad-driven hyperscalers face differentiated margin scrutiny, while hardware and memory architecture beneficiaries—such as advanced semiconductor suppliers—exhibit resilient cash generation supported by sustained structural demand.
In parallel, consumer and healthcare verticals display asymmetric outcomes; pharmaceutical demand tied to next-generation metabolic therapeutics generates substantial valuation support, contrasting sharply with workflow software multiples undergoing contraction. As cross-asset rates and energy uncertainty remain elevated, capital allocations increasingly prioritize pricing power, balance sheet durability, and visible structural earnings over speculative multiple expansion.
Informational only — not financial advice. This digest interprets publicly available information and data for educational purposes and does not constitute a recommendation to buy, sell or hold any financial product. Verify sources and consider your own circumstances before making financial decisions.