
Hyperscale Balance Sheet Restructuring and Sector Return Asymmetry
Quantitative analysis of mega-cap capital reallocation toward AI infrastructure alongside cross-asset sector dispersion.
Global equity factor dynamics are increasingly dominated by an aggressive reallocation of balance sheet capacity toward synthetic intelligence and advanced compute infrastructure. Hyperscale operators are shifting capital expenditure budgets to levels historically reserved for national infrastructure projects, concurrently executing aggressive workforce rationalization programs to fund compute cluster expansions. This dynamic is precipitating notable cross-asset performance dispersion, reflecting divergent sensitivity to high-capex regimes and shifting liquidity distribution across sectors.
Hyperscale Capex Realignment and Labor Re-Engineering
Corporate disclosure trends highlight a systemic realignment within mega-cap balance sheets. Meta’s structured financing maneuvers to deploy up to $95 billion into dedicated artificial intelligence build-outs, paired with workforce re-engineering such as Microsoft's buyout initiatives covering substantial organizational segments, mark a pivot from traditional operating leverage toward fixed compute asset capitalization. Concurrently, public market sentiment is absorbing potential frontier model listings, highlighted by Anthropic’s IPO filing, injecting fresh capital into private-to-public structural valuation pipelines.
This aggressive pivot alters corporate cash-flow profiles across three distinct vectors:
- Operating Expense to Capital Expenditure Migration: Routine labor allocations are being structurally deflated to absorb heightened depreciation schedules and debt issuance associated with high-density data center deployment and sovereign-grade compute clusters.
- Capital Scarcity in Secondary Sectors: As capital markets absorb concentrated debt and equity issuances from technology conglomerates, non-compute industrial and defensive cohorts face relative balance-sheet crowding.
- Supply-Chain Margin Transmission: Specialized fabrication nodes and semiconductor equipment developers capture outsized free cash flow as hyperscalers bid for high-bandwidth memory (HBM) and next-generation packaging solutions.
Cross-Asset Factor Regimes: Sector Return Dispersion
Factor Dispersion and Cross-Asset Transmission
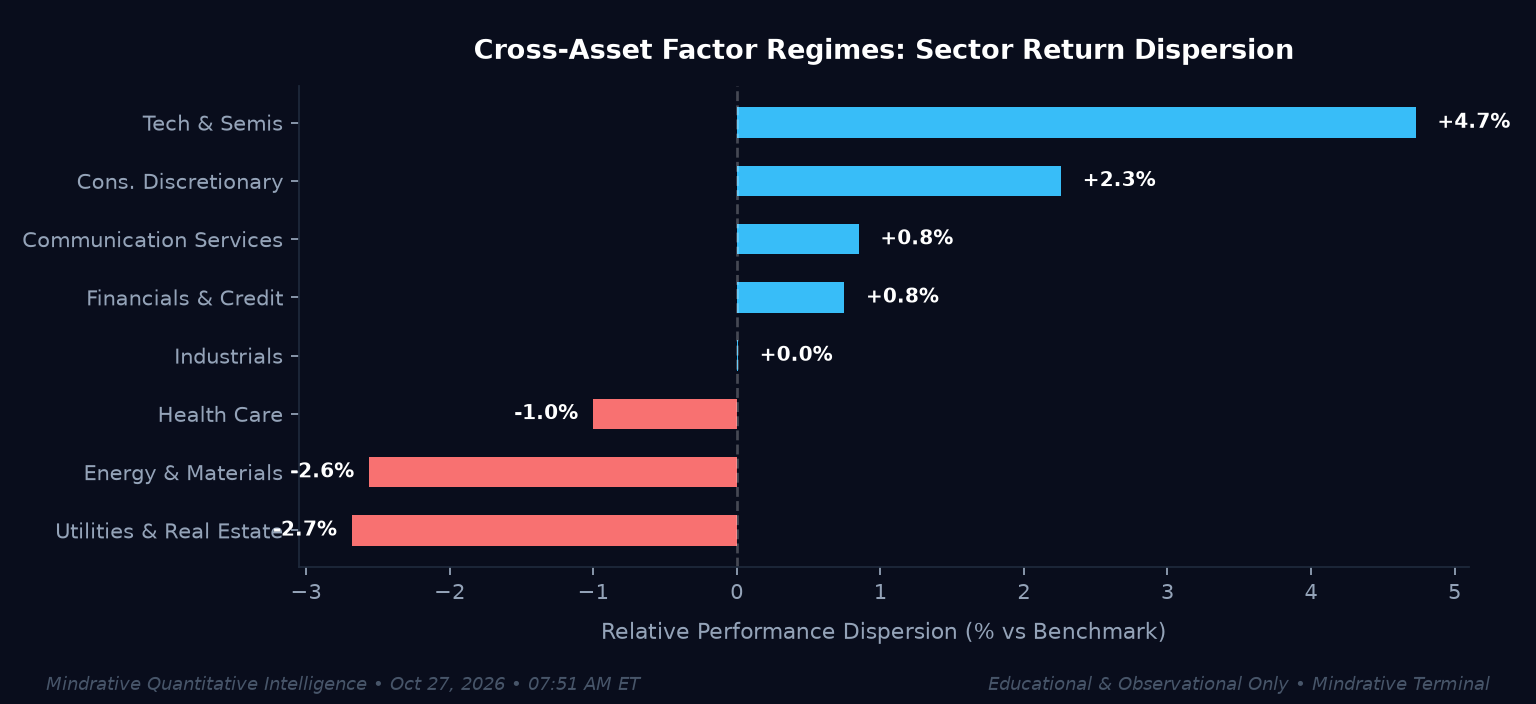
Empirical performance data displayed in Figure 1 indicates pronounced sector return dispersion relative to benchmark equity indices. Tech & Semis exhibit an excess return profile of +4.7%, driven by structural revenue guarantees anchored in hyperscale compute procurement. Consumer Discretionary (+2.3%) and Communication Services (+0.8%) maintain modest positive tracking, reflecting digital consumer exposure and automated platform efficiencies.
Conversely, capital-intensive rate-sensitive cohorts demonstrate pronounced relative lag:
- Utilities & Real Estate (-2.7%): Despite long-term demand narratives tied to data center grid connectivity, near-term duration sensitivity and funding overhead continue to depress sector valuations.
- Energy & Materials (-2.6%): Commodity input volatility and softening cyclical demand metrics across traditional industrial fabrication compress relative spreads.
- Health Care (-1.0%): Allocator rotation toward momentum and high-beta growth factors has led to liquidity outflows from defensive non-cyclical sleeves.
- Industrials (+0.0%): Divergent operational profiles—exemplified by aerospace and defense production stabilization at firms like Boeing alongside localized supply constraints—render overall industrial factor returns neutral relative to the broader benchmark.
Structural Liquidity and Balance Sheet Vulnerabilities
The concentration of performance within compute supply chains introduces idiosyncratic balance sheet vulnerabilities across institutional portfolios. As European equities face valuation pressure from banking earnings headwinds—exemplified by HSBC results—the transmission of capital flows remains hyper-concentrated in North American and select Asian technology supply chains. Consequently, market breadth metrics are narrowing, elevating systemic fragility should compute return-on-invested-capital (ROIC) timelines elongate beyond prevailing market expectations.
Informational only — not financial advice. This digest interprets publicly available information and data for educational purposes and does not constitute a recommendation to buy, sell or hold any financial product. Verify sources and consider your own circumstances before making financial decisions.