Navigating the Cross-Asset Matrix: What the Math Tells Us About Late-Cycle Realities and the AI Capex Cycle
August 24, 2026 • 3 min read
Most market commentary gets trapped debating backward-looking headlines. Between front-page speculation on the upcoming Federal Reserve rate decision and endless debates over whether mega-cap AI infrastructure capex is a sustainable secular trend or an overextended bubble heading into NVIDIA earnings, the narrative machine rarely stops.
For quantitative allocators and multi-asset desks, however, the real story is written in the cross-asset covariance matrix long before it shows up in consensus narratives.
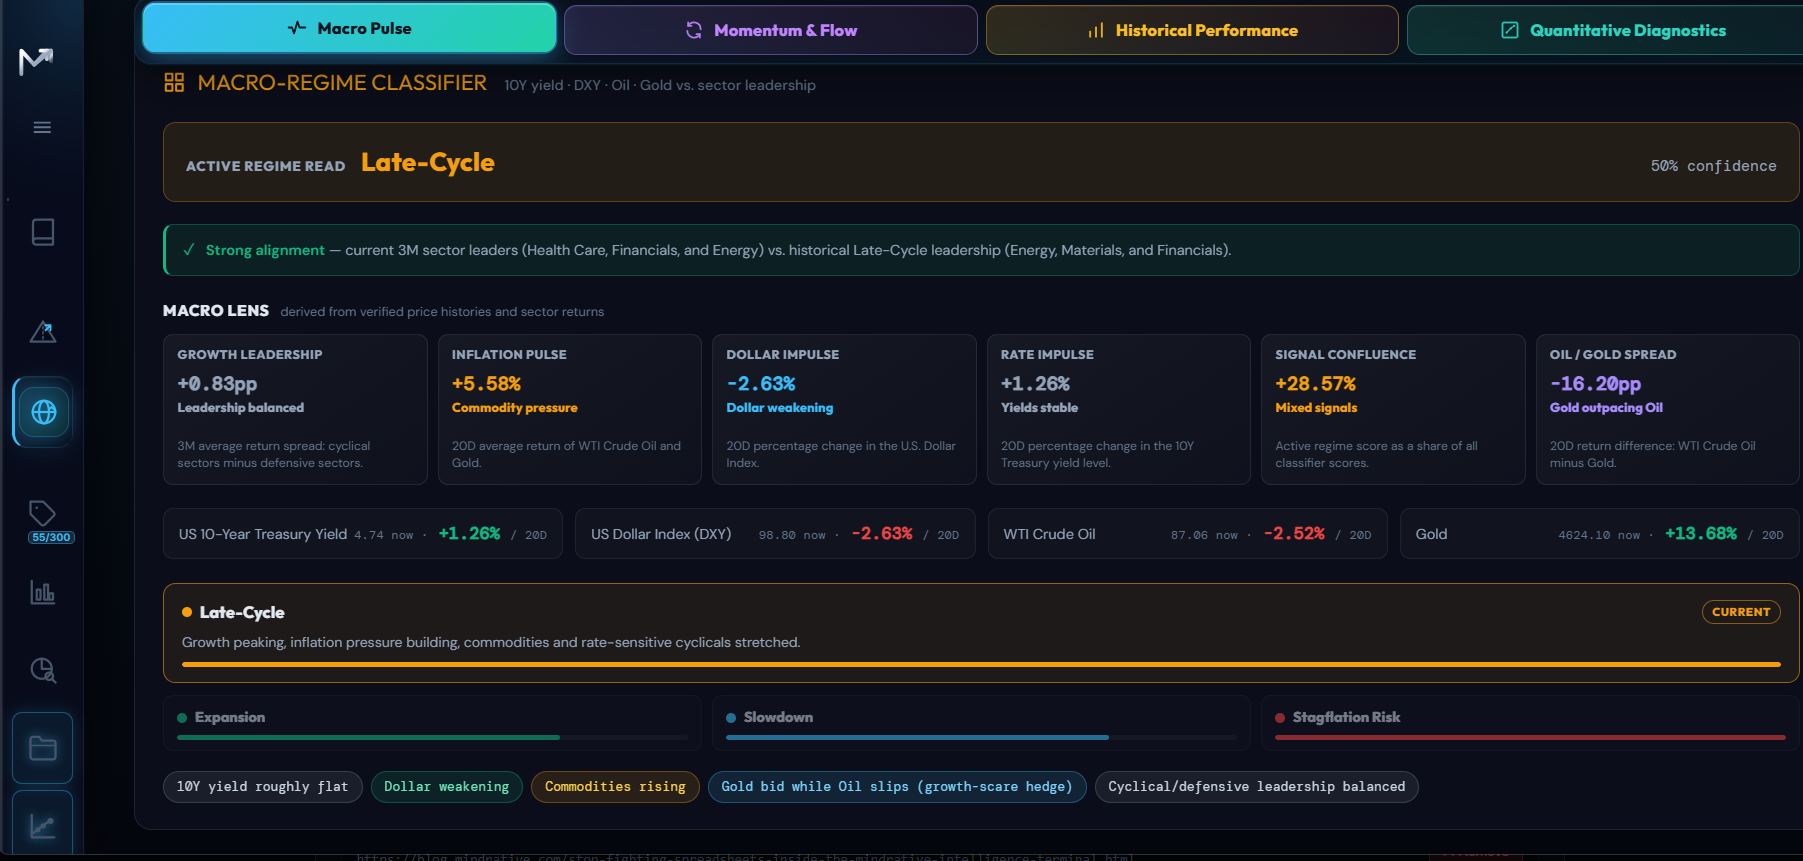
Telemetry from the Mindrative Quant Terminal registers an Active Late-Cycle Read (50.00% model confidence interval, +28.57% Signal Confluence).
Here is a statistical decomposition of the data and what the underlying market mechanics are actually pricing in.
Quantitative Telemetry Snapshot
- Macro Regime Read: Late-Cycle (50% Confidence | +28.57% Confluence)
- Oil / Gold Spread: -16.20 pp (WTI -2.52% at $87.06 vs. Gold +13.68% at $4,624.10 over 20D)
- Inflation Pulse: +5.58% (Trailing 20D Mean of WTI and Gold)
- Dollar Impulse: -2.63% (DXY softening to 98.80)
- Rate Impulse: +1.26% (US 10-Year Benchmark steady at 4.74%)
- Trailing 3M Leaders: Health Care (XLV), Financials (XLF), Energy (XLE)
1. The Real-Asset Divergence: Gold Outpacing Energy
The most pronounced dislocation across our asset vectors is the -16.20 percentage point Oil/Gold spread over the trailing 20-day window:
$$\Delta_{\text{Spread}} = R_{\text{WTI}} - R_{\text{Gold}} = -2.52\% - 13.68\% = -16.20\text{ pp}$$
When gold accelerates (+13.68% / 20D) while crude softens (-2.52%), the matrix captures a classic statistical divergence:
- Capital is pricing sovereign balance-sheet expansion, currency debasement, and term-premium adjustments into precious metals.
- Concurrently, physical industrial and cyclical demand expectations (proxied by crude) are flattening.
- The combined arithmetic mean (+5.58% Inflation Pulse) demonstrates that underlying baseline nominal pressures remain embedded across the commodity complex despite softer physical consumption.
2. The Yield vs. Currency Decoupling Ahead of Central Bank Rate Calls
Standard linear regression models assume a positive covariance between nominal sovereign bond yields and domestic currency strength via interest rate parity channels. Right now, that correlation has broken down:
- US 10-Year Yield: Anchored at 4.74% (+1.26% Rate Impulse).
- US Dollar Index (DXY): Softening by -2.63% to 98.80.
As market participants parse probabilities for the upcoming central bank rate decision, benchmark sovereign yields remain anchored near cycle highs while the currency weakens. The statistical model identifies a phase where sovereign debt supply and duration absorption exert greater pricing power on FX than baseline short-term rate differentials.
3. Factor Dispersion: AI Infrastructure Narrative vs. Equal-Weighted Breadth
While cap-weighted index performance remains heavily driven by mega-cap semiconductor earnings expectations and hyperscaler data center spending, equal-weighted sector breadth presents a distinct mathematical picture:
- The Growth Leadership Spread (+0.83 pp) has compressed to near parity, demonstrating that broad cyclical outperformance has stalled relative to defensive aggregates.
- Trailing 3-month leadership is clustered in Health Care, Financials, and Energy-aligning with historical late-cycle baseline clusters characterized by high return on invested capital (ROIC), strong pricing power, and balance-sheet durability.
The Quantitative Modeling Takeaway: Lookback Window Precision
When evaluating factor risk premia against an anchored 4.74% risk-free hurdle rate ($R_f$), calculating the Sharpe Ratio requires rigorous variance estimation:
$$S = \frac{E[R_p - R_f]}{\sigma_p}$$
A frequent modeling pitfall during regime inflection points-particularly amid high-variance catalysts like mega-cap tech earnings-is applying a static, uniform macro lookback window across the entire covariance matrix.
When fast-moving assets (such as the Gold vector at +13.68%) decouple from slower-moving macro aggregates, a global lookback window smooths over critical variance spikes. Calibrating the lookback_days parameter directly to the individual symbol's specific volatility structure ensures that risk-adjusted models capture genuine covariance shifts rather than lagging macro noise.
Discussion for the Quantitative & Multi-Asset Community:
When stress-testing portfolio covariance matrices against sticky 4.74% benchmark yields and tech capex concentration, how is your desk dynamically adjusting symbol-specific lookback windows to prevent historical variance from lagging current cross-asset momentum?
#QuantitativeFinance #MacroEconomics #AssetAllocation #RiskManagement #PortfolioOptimization #DataAnalytics #FinTech #CapitalMarkets
Informational only — not financial advice. This digest interprets publicly available information and data for educational purposes and does not constitute a recommendation to buy, sell or hold any financial product. Verify sources and consider your own circumstances before making financial decisions.