Beyond Traditional Sectors: Why Next-Generation Taxonomy is the Core Engine of Modern Portfolio Construction
August 31, 2026 • 4 min read
The Blind Spot in Traditional Diversification
Look at any conventional brokerage statement or legacy portfolio report, and you will likely see a pie chart broken down into 11 Global Industry Classification Standard (GICS) sectors: Information Technology, Industrials, Utilities, Financials, Healthcare, and so on.
On paper, an investor holding 600 individual stocks across all 11 sectors looks impeccably diversified.
In reality, that diversification is often an illusion.
When markets experience sharp liquidity adjustments or rapid technological disruption, standard sector labels break down. If your tech allocation owns semiconductor designers, your industrial allocation holds liquid cooling equipment manufacturers, and your utility holdings focus on merchant nuclear power plants, traditional reporting tells you that you own three unrelated sectors.
A dynamic, network-aware taxonomy tells you the truth: You are running an aggressive, concentrated exposure to the AI & Compute Infrastructure Value Chain.
To illustrate how modern portfolio managers identify, measure, and navigate these cross-asset relationships, let’s explore a real-world visualization from our Celestial Thematic Explorer.
Deconstructing the Galaxy: A Visual Breakdown
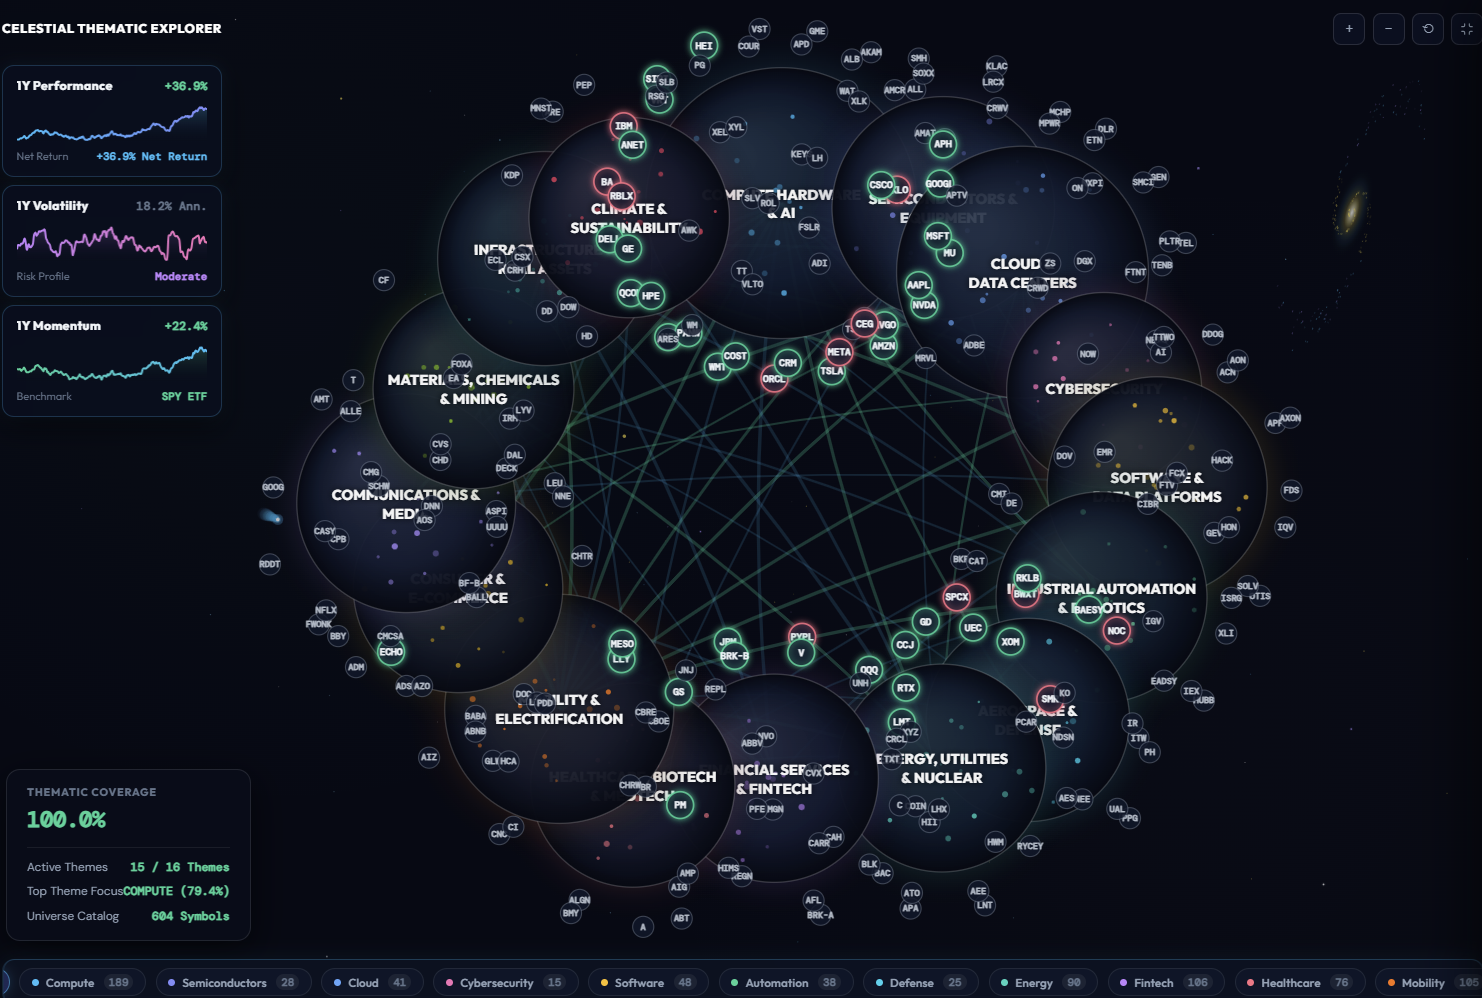
At first glance, the explorer looks like an astronomical chart. In quantitative portfolio architecture, this is a topological network graph. It maps companies not by arbitrary sector codes, but by thematic relevance, supply-chain connectivity, and capital flows.
Here is what the visual language communicates:
1. Cluster Scale & Gravity (Thematic Weighting)
Each large circular node represents an investment theme—such as Compute Hardware, Cloud & Data Centers, Energy, Utilities & Nuclear, or Biotech & Healthcare. The size of the cluster reflects both the symbol density (e.g., 189 assets in Compute, 106 in Fintech) and its systemic footprint in the model.
2. Network Interconnections (Shared Macro & Supply Drivers)
Notice the dense web of green and blue filaments running through the center of the graph, binding Semiconductors & Equipment directly to Energy, Utilities & Nuclear.
- The Takeaway: High-performance computing clusters cannot scale without gigawatts of clean, reliable baseload power. Companies like CEG (Constellation Energy), VST (Vistra), and CCJ (Cameco) are no longer trading strictly as defensive dividend plays; they are functionally tethered to NVDA (NVIDIA), MSFT (Microsoft), and DELL (Dell Technologies).
3. Ring Color Dynamics (Relative Momentum & Dispersion)
- Bright Green Rings highlight individual nodes exhibiting powerful positive momentum and leading relative strength (e.g., VRT, DELL, AMD, WMT, ECHO).
- Red / Pink Rings signal corrective pullbacks, asset-specific headwinds, or negative momentum divergence (e.g., IBM, BA, ORCL, PYPL, NOC).
- For allocators, this visual dispersion instantly surfaces rebalancing candidates and factor rotation across the supply chain.
The Three Pillars: Why Graph-Based Taxonomy Drives Alpha
Whether managing an institutional multi-asset mandate or running a focused personal portfolio, incorporating multi-dimensional taxonomy delivers three critical advantages:
A. True Factor Isolation vs. Nominal Diversification
Nominal diversification is counting the number of tickers in a portfolio. True diversification is measuring the correlation of revenue engines.
In the portfolio shown above, 15 out of 16 themes are active across 604 securities. However, the taxonomy reveals that 79.4% of total thematic focus is centered on Compute and AI Enablers. Rather than pretending the book is broadly market-neutral, the allocator knows exactly what the portfolio is: an asymmetric, growth-optimized AI infrastructure strategy with defensive and cyclical overlays.
B. Granular Performance Attribution (Allocation vs. Selection)
Did your portfolio beat the benchmark because you picked exceptional individual equities (Selection Effect), or because you were overweighted in the right thematic macro wave (Allocation Effect)?
A structured hierarchical taxonomy separates broad structural tailwinds from asset-specific alpha generation.
C. Proactive Risk Mitigation & Supply-Chain Bottlenecks
When macroeconomic stress or supply-chain bottlenecks hit a specialized sub-tier (such as photolithography machinery, advanced packaging, or uranium spot pricing), linear spreadsheets rarely show the ripple effect in time. A relational taxonomy graph instantly highlights which downstream sectors—from Aerospace & Defense to Consumer E-Commerce—are directly tethered to the disruption.
Actionable Takeaway for Allocators
Building an enduring portfolio is not about collecting as many uncorrelated tickers as possible; it is about understanding the hidden gravity between the assets you already own.
As secular trends like artificial intelligence, energy transition, and industrial robotics reshape global markets, static classification systems will continue to produce unintended risk. Upgrading portfolio architecture to a relational, thematic taxonomy transforms raw market noise into clean, actionable intelligence.
Informational only — not financial advice. This digest interprets publicly available information and data for educational purposes and does not constitute a recommendation to buy, sell or hold any financial product. Verify sources and consider your own circumstances before making financial decisions.
- Navigating the Cross-Asset Matrix: What the Math Tells Us About Late-Cycle Realities and the AI Capex Cycle
- Stop Fighting Spreadsheets: Inside the Mindrative Intelligence Terminal
- Master the Mindrative Portfolio Workflow | Next-Gen Quantitative Analy
- The $17 Million Lookback Trap: What 25 Years of Market Regimes Teach Us About Portfolio Construction