The $17 Million Lookback Trap: What 25 Years of Market Regimes Teach Us About Portfolio Construction
September 9, 2026 • 4 min read
Most modern portfolio dashboards look like a video game. Turn on a 10-year view, and the screen glows emerald green: Nvidia compounding at 85% CAGR, Micron up 62x, and smooth growth curves that make a $400,000 base look like an inevitable $20 million retirement account.
At Mindrative, we built our quantitative analytics engine specifically to challenge these optical illusions.
When you build an aggressive, high-conviction book, understanding your expected terminal wealth isn't about running an optimistic spreadsheet formula—it’s about testing your assets against real historical stress cycles. Here is what happened when we stress-tested a 44-asset, tech-heavy demo portfolio through 10,000 Monte Carlo paths using Mindrative's Multi-Regime Engine.
The Anatomy of a High-Beta Portfolio
The demo book reflects what many modern growth investors hold: heavy concentration in foundational semiconductor and tech leaders ($MU, $NVDA,$GOOGL, $MSFT,$AAPL, $AVGO), rounded out with high-beta consumer discretionary ($TSLA) and cyclical financials ($GS,$JPM).
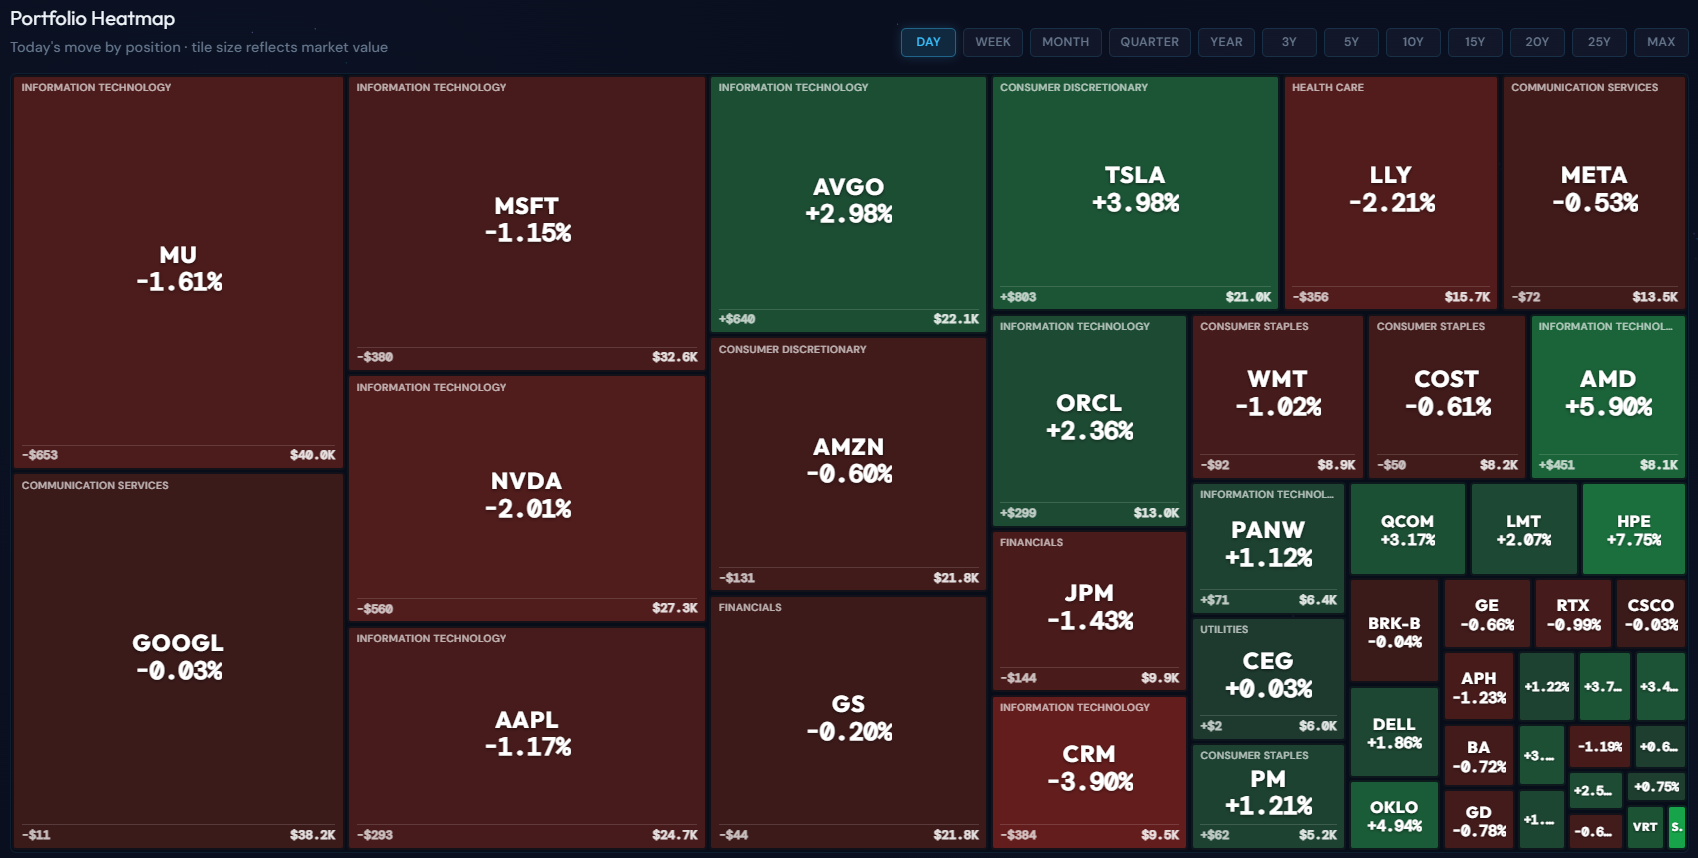
- Today’s Tape (1-Day Drift): Mega-cap tech slips. Nvidia is off -2.01%, Micron slides -1.61%, and Salesforce drops -3.90%. Selective strength in names like AMD (+5.90%) and TSLA (+3.98%) keeps it interesting, but broad market rotation drags total equity down.
- The 10-Year Rearview Mirror: Pure survivor outperformance. Holding this cluster over the past decade felt like a cheat code—$NVDA returned 150x, $AMD delivered 61.3x, and $AVGO delivered 25.4x.
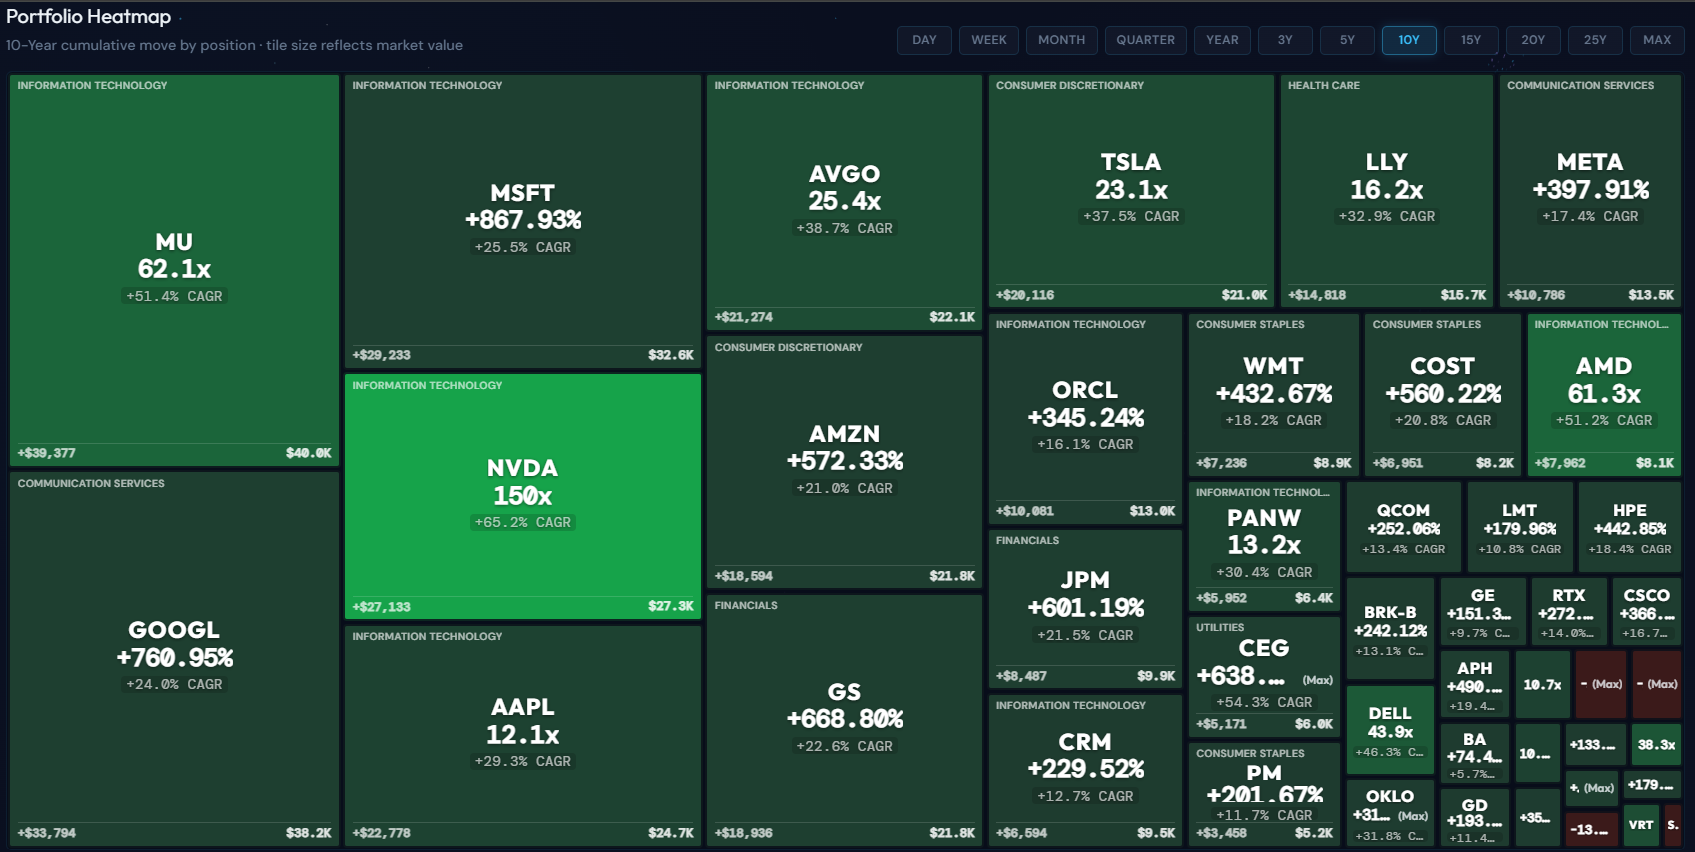
Looking in the rearview mirror is intoxicating. But portfolio engines project forward, not backward. The real question is: what lookback assumptions are driving your forward simulations?
The Calibration Trap: 3-Year vs. 25-Year Lookback
If you calibrate a 10-year Monte Carlo projection using only the last 3 years of market data, here is what standard tools will tell you:
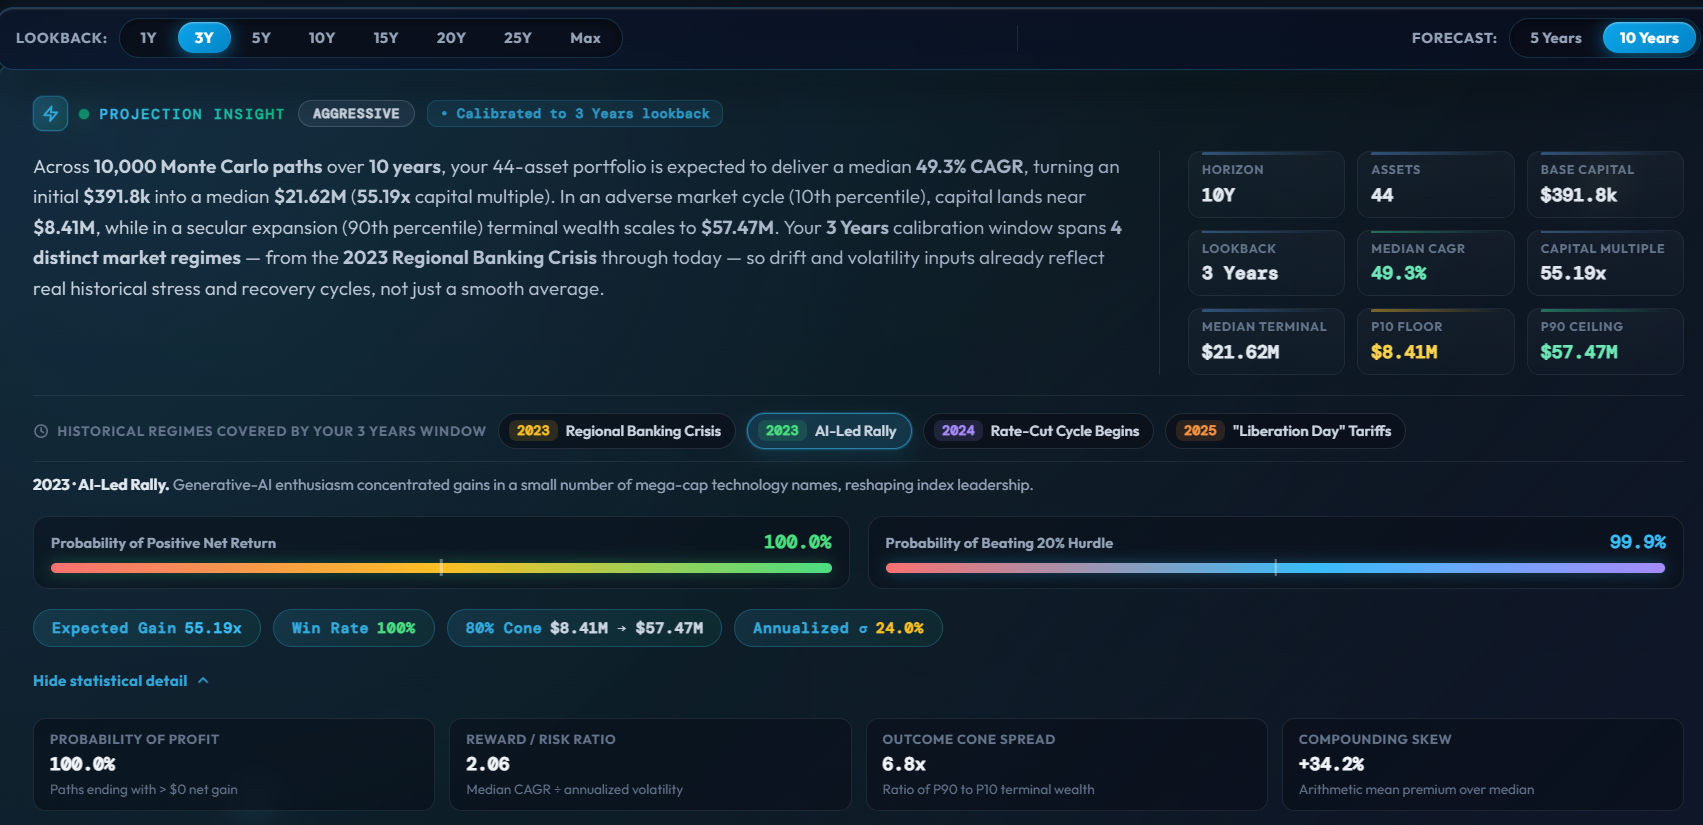
- 3-Year Lookback Projection: Median CAGR of 49.3%, projecting a $391.8k base into $21.62M (a 55.19x capital multiple).
That projection is pure financial fiction. A 3-year calibration window only knows the post-2022 rate cycle, the generative AI infrastructure boom, and relentless mega-cap multiple expansion. It completely ignores structural drawdowns.
When we toggle Mindrative’s calibration window to 25 Years, the engine forces the portfolio to pass through 13 distinct historical regimes—from the 2001 Dot-Com crash and 9/11, through the 2008 GFC, the 2011 Eurozone debt crisis, 2018 Volmageddon, the 2022 rate hikes, and the 2025 tariff shock.
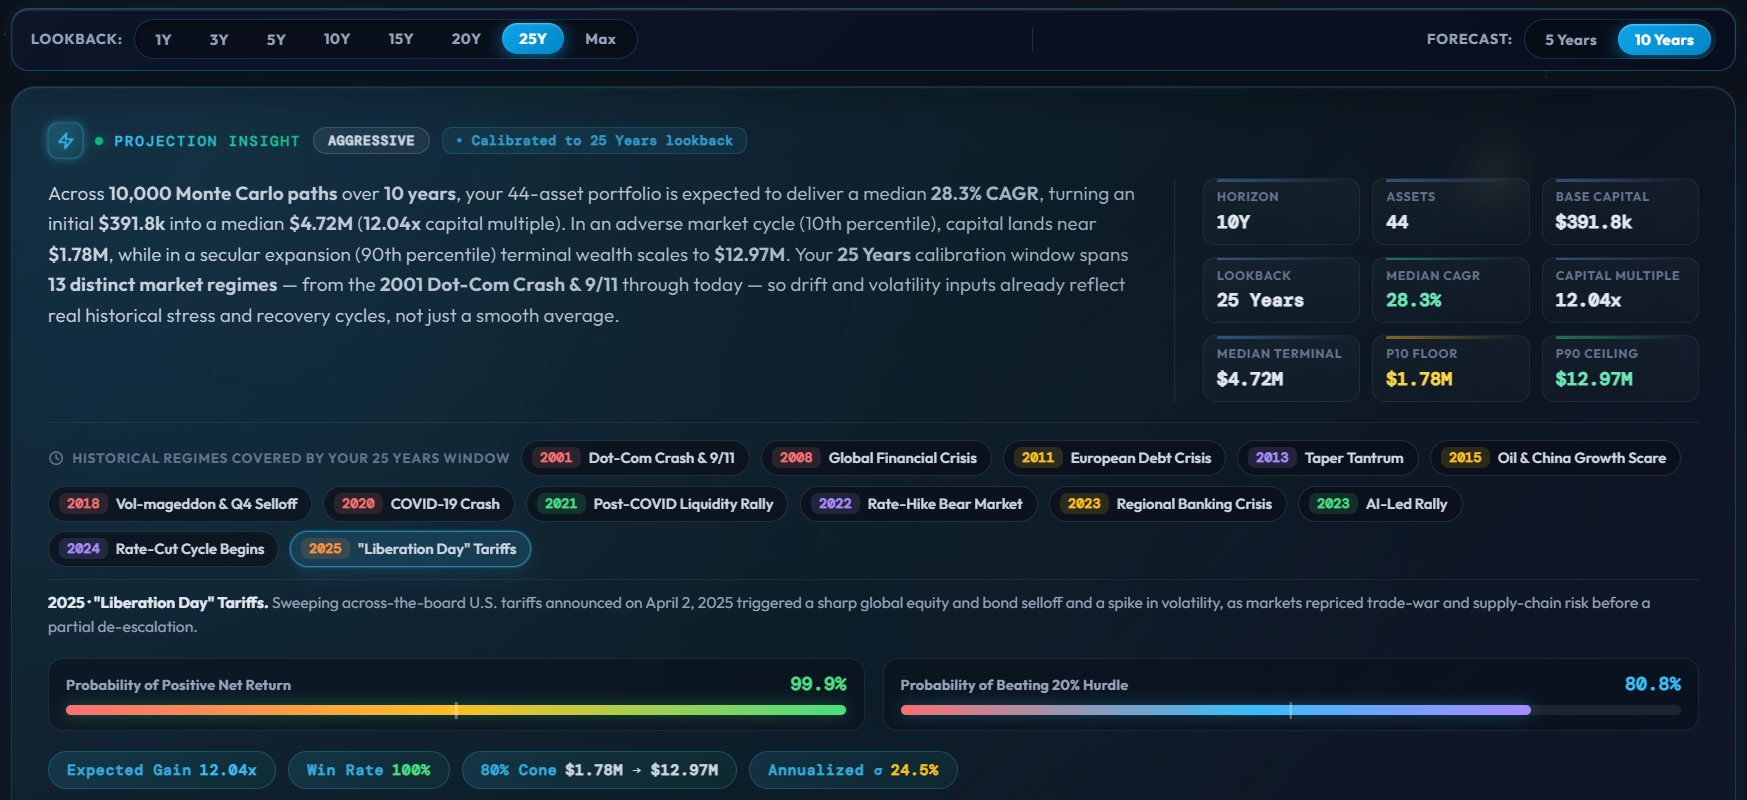
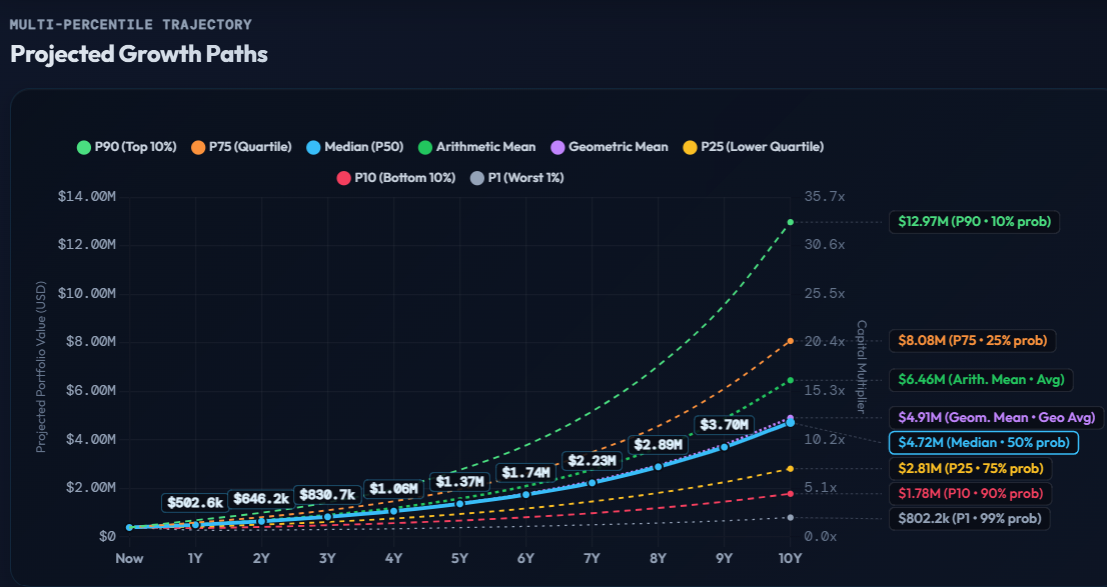
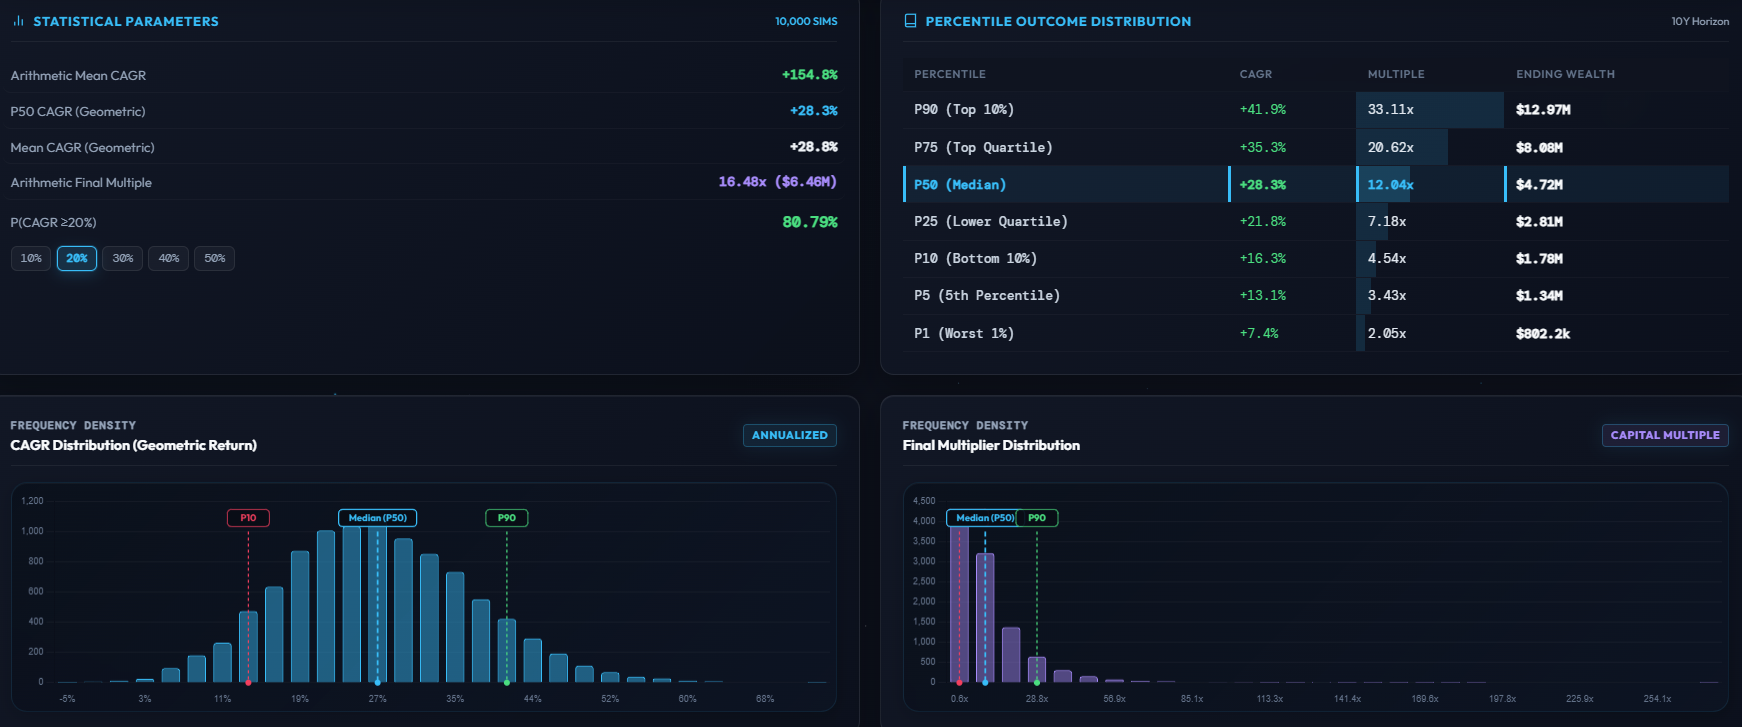
Grounding the calibration over 25 years shaves off nearly $17 million of illusory upside, resetting the median expected outcome from a fantasy $21.62M to an institutional-grade, risk-adjusted $4.72M.
3 Quantitative Realities Every Modern Investor Must Model
1. Arithmetic Skew vs. Geometric Compounding
In our 25-year simulation, the Arithmetic Mean CAGR was +154.8%, yet the Geometric Median CAGR sat at +28.3%.
Why the massive discrepancy? A handful of runaway paths in Monte Carlo simulations artificially warp the arithmetic average. You don’t live in an arithmetic average—you compound along a single geometric path. Mindrative isolates median and quantile geometric trajectories so you don't confuse statistical outlier runs with your baseline plan.
2. The Law of Large Numbers
Expecting a mega-cap tech basket to compound at nearly 30% indefinitely means assuming companies with $2 trillion and $3 trillion market caps will scale into $20 trillion to $40 trillion enterprises over a decade. Multi-regime modeling factors in multiple compression, margin normalization, and cyclical capex pauses.
3. Volatility Drag in Capex Cycles
Semiconductor and infrastructure heavyweights drive incredible upside during liquidity expansions, but hardware downcycles are historically brutal. Mindrative’s regime-based volatility tracking quantifies how much volatility drag reduces your compounded terminal wealth—giving you the data needed to set dynamic stop-loss or rebalancing thresholds.
Move Beyond Passive Dashboards with Mindrative
A portfolio plan built on single-point estimates or narrow bull-market backtests leaves you completely blind to adverse regimes. Real portfolio intelligence means knowing your numbers across every quartile:
- Multi-Regime Stress Calibration: Test your assets against 25+ years of historical market crashes and liquidity cycles.
- 10,000-Path Monte Carlo Engine: Map your true probability cone, from P10 floors to P90 ceilings.
- Granular Asset Allocation Insights: See exactly which names contribute to alpha versus which assets introduce excessive volatility drag.
Stop guessing your forward wealth. Run your actual holdings through Mindrative and see how your portfolio holds up when the market stops playing on easy mode.
Want to see how your own asset mix holds up when tested across 25 years of real market stress? Run your holdings through our interactive multi-regime engine at https://mindrative.com/projection.html
Informational only — not financial advice. This digest interprets publicly available information and data for educational purposes and does not constitute a recommendation to buy, sell or hold any financial product. Verify sources and consider your own circumstances before making financial decisions.
- Beyond Traditional Sectors: Why Next-Generation Taxonomy is the Core Engine of Modern Portfolio Construction
- Master the Mindrative Portfolio Workflow | Next-Gen Quantitative Analy
- Stop Fighting Spreadsheets: Inside the Mindrative Intelligence Terminal
- Navigating the Cross-Asset Matrix: What the Math Tells Us About Late-Cycle Realities and the AI Capex Cycle
- Michael Dell, 100 Kilowatts, and a 7.10% Tail: What the Vera Rubin Milestone Teaches Us About Portfolio Risk