Michael Dell, 100 Kilowatts, and a 7.10% Tail: What the Vera Rubin Milestone Teaches Us About Portfolio Risk
September 14, 2026 • 3 min read
There’s something quietly humbling about the photo Michael Dell shared of the world’s first production NVIDIA Vera Rubin NVL72 rack landing at CoreWeave.
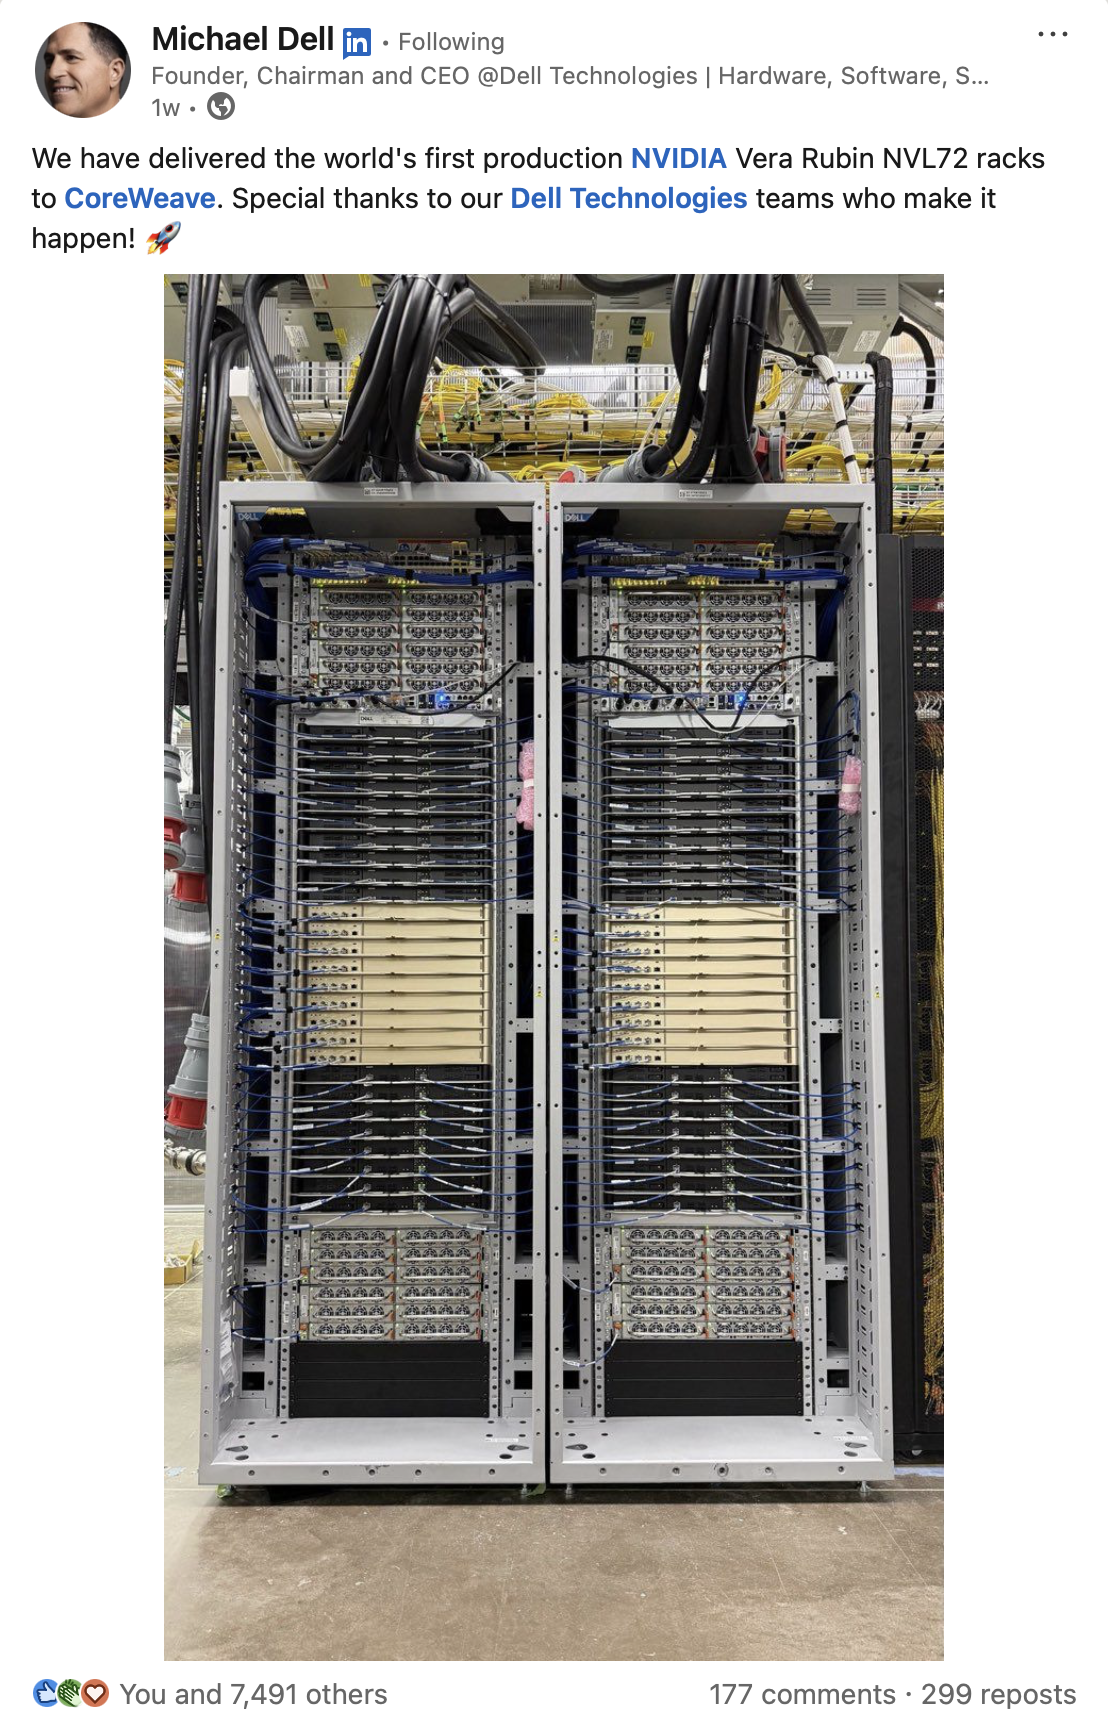
If you look past the metal cabinet and tidy cable ties, you realize you're staring at thousands of hours of stubborn, physical problem-solving. It links 72 Rubin GPUs and 36 Vera CPUs into a unified fabric over a 260 TB/s NVLink 6 interconnect. Drawing well over 100 kilowatts per rack, traditional air cooling is completely out of the equation—requiring custom blind-mate liquid-cooling manifolds just to keep the silicon from melting. It’s a vivid reminder that compute isn’t abstract code floating in the ether; it is heavy, industrial machinery bolted to a reinforced concrete floor.
For investors who recognized this supply chain bottleneck early, the compounding returns have been generational.
Opening up the Mindrative Portfolio Heatmap across a demo equal-weighted $5.5M+ basket tracking the four core hardware players in that frame reveals an extraordinary 5-year run:
- Dell Technologies (DELL): Up 10.6x with a +63.2% CAGR, proving that complex thermal integration and rapid enterprise deployment maintain a resilient moat against commoditized assemblers.
- NVIDIA (NVDA): Up +918.85% with a +59.1% CAGR, capturing the lion's share of hardware economic rent by selling cohesive rack-scale architectures rather than standalone chips.
- Micron Technology (MU): Up 13.2x with a +70.1% CAGR, demonstrating that feeding multi-step agentic models requires low-latency HBM and rack-scale NVMe throughput to keep compute pipelines from starving.
- CoreWeave (CRWV): Showing +123.40% post-entry with a +75.0% CAGR, driven by an agile, liquid-first data center footprint that enables up to 10× higher token throughput per megawatt than legacy retrofitted facilities.
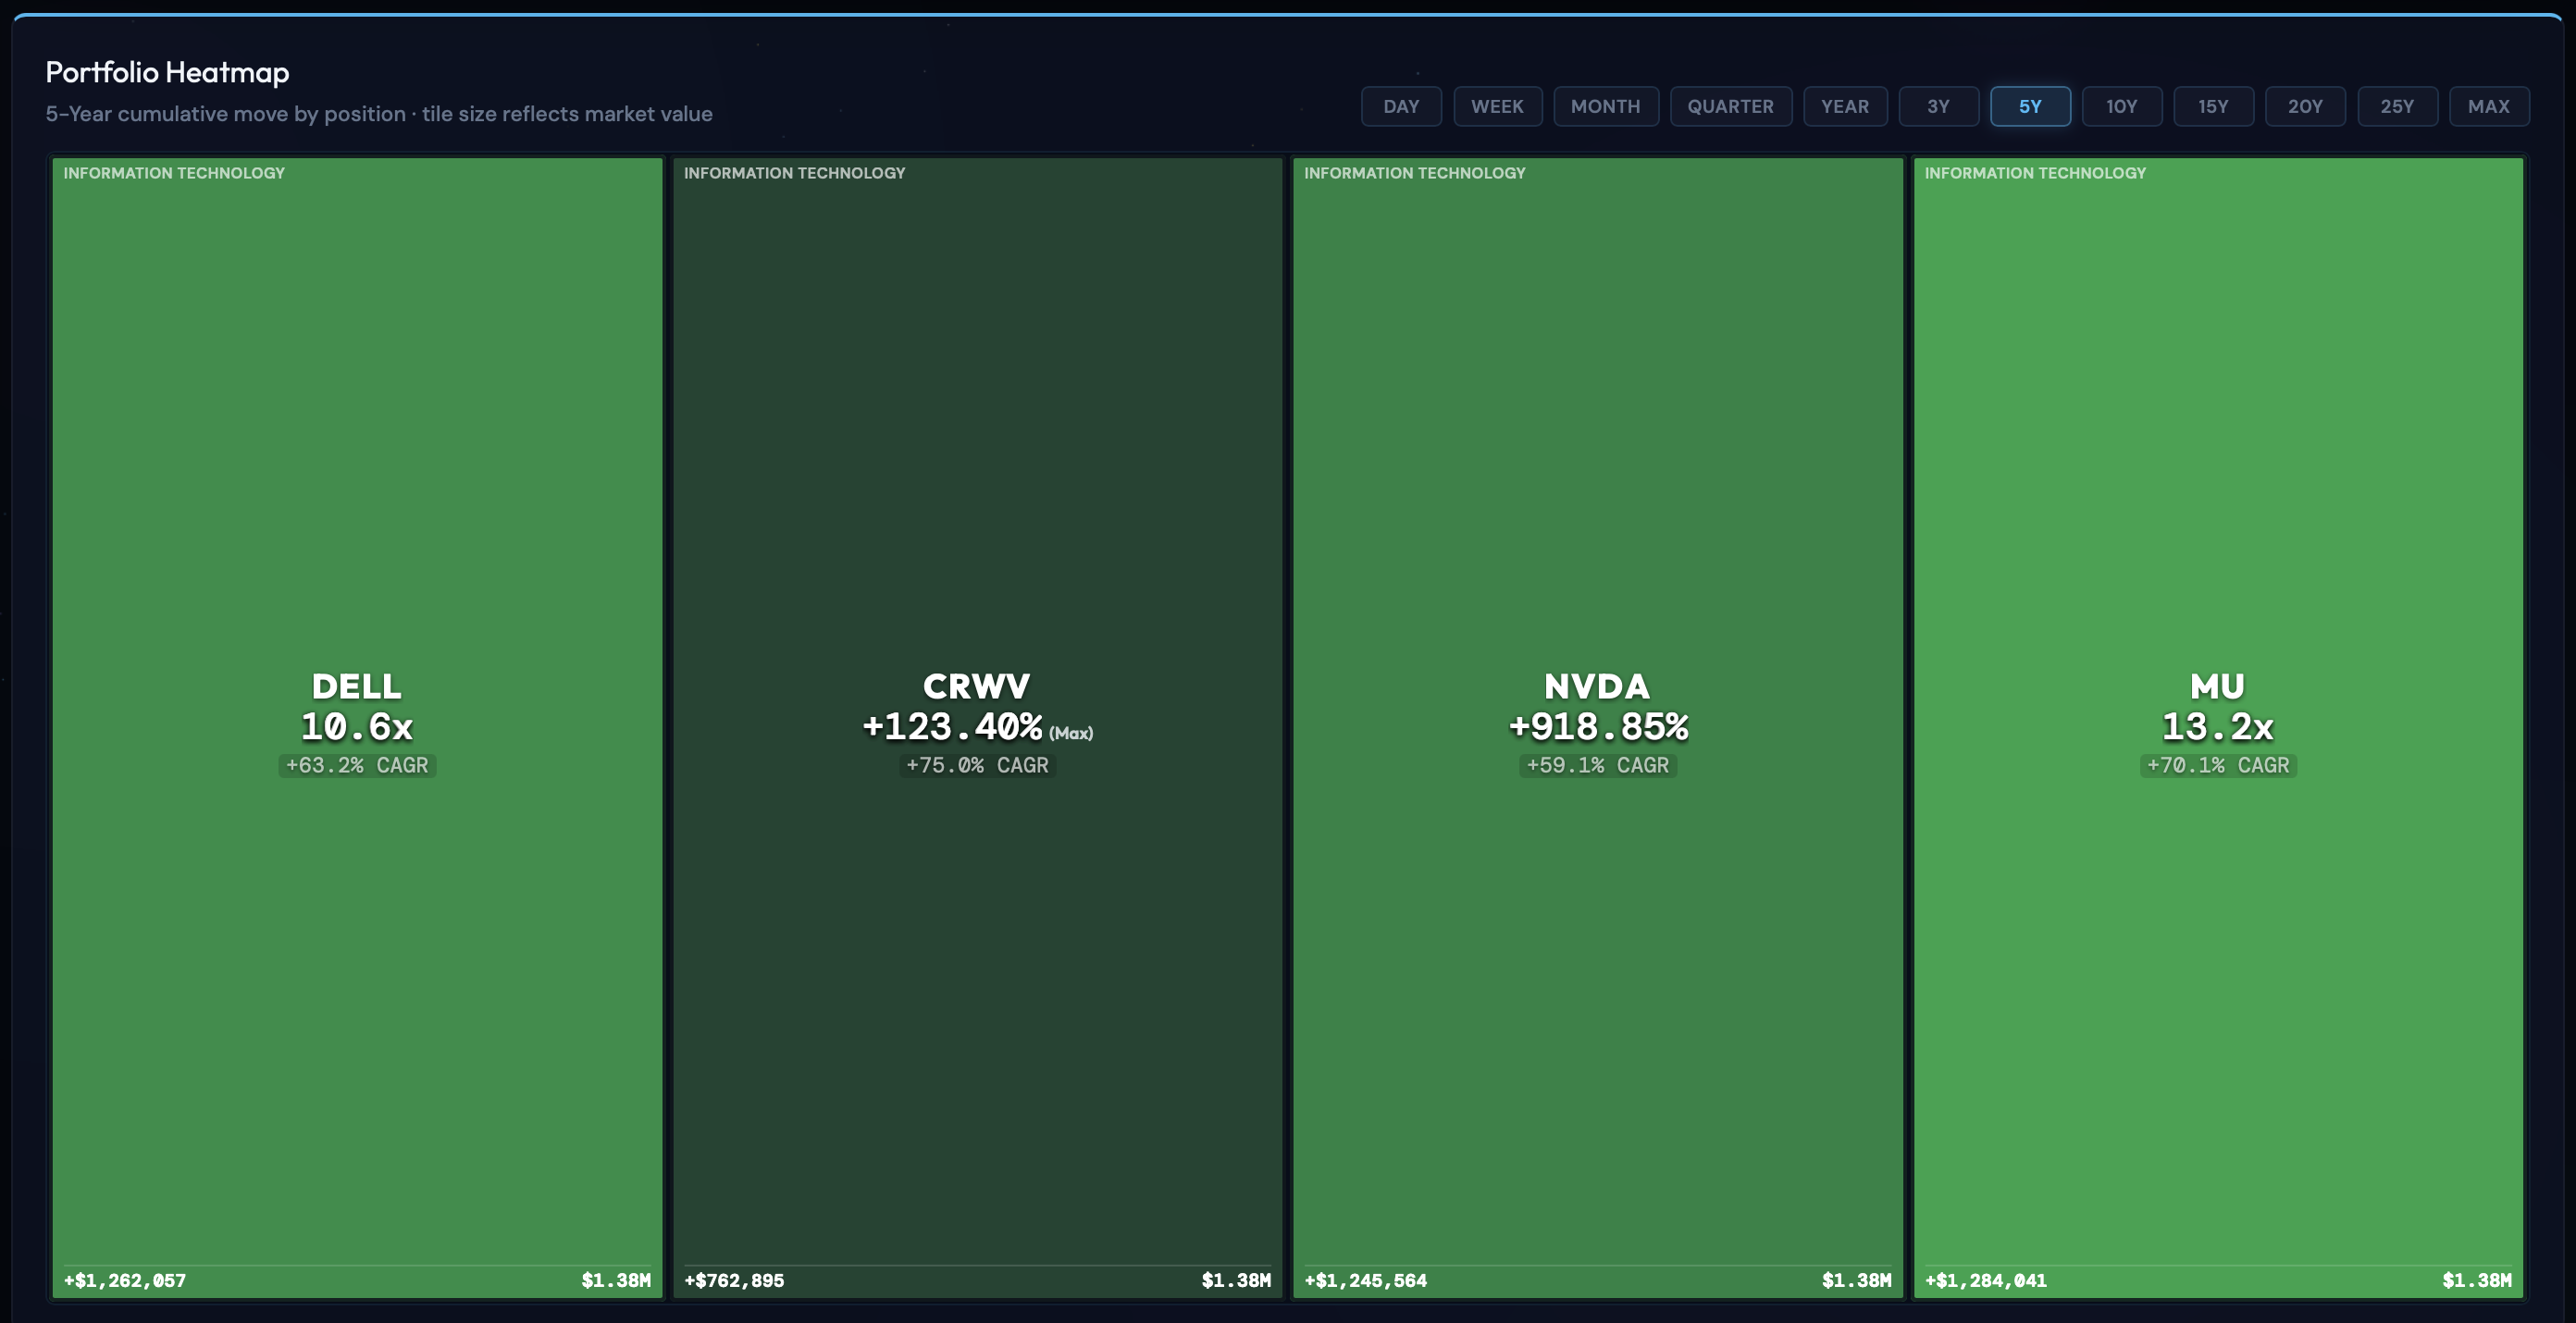
Seeing all that bright green across the portfolio heatmap feels like pure validation. But conviction without quantitative humility has a habit of getting punished.
When you toggle to Mindrative’s Multi-Factor TFR Analytics, the risk models provide a necessary, sobering counterweight to the upside:
- The Illusion of 4-Way Diversification: While an equal-weighted allocation ($1.38M per position) appears balanced on a standard ledger, these assets share extreme factor covariance. They are tied to the exact same enterprise Capex cycle, grid interconnect timelines, and semiconductor supply chains. When the regime shifts, their correlations tighten toward 1.0.
- Worst-Case 1-Day Loss (95% Value at Risk): 5.10%. Across this concentrated basket, normal market turbulence can erase over a quarter of a million dollars in a single trading session with a 5% statistical probability.
- Expected Shortfall (CVaR): 7.10%. The empirical Kernel Density Estimation (KDE) curve highlights pronounced fat-tail behavior. If the portfolio breaches that 95% threshold into the worst 5% of trading days, the average expected loss isn't just 5%—it is 7.10% in a single day.
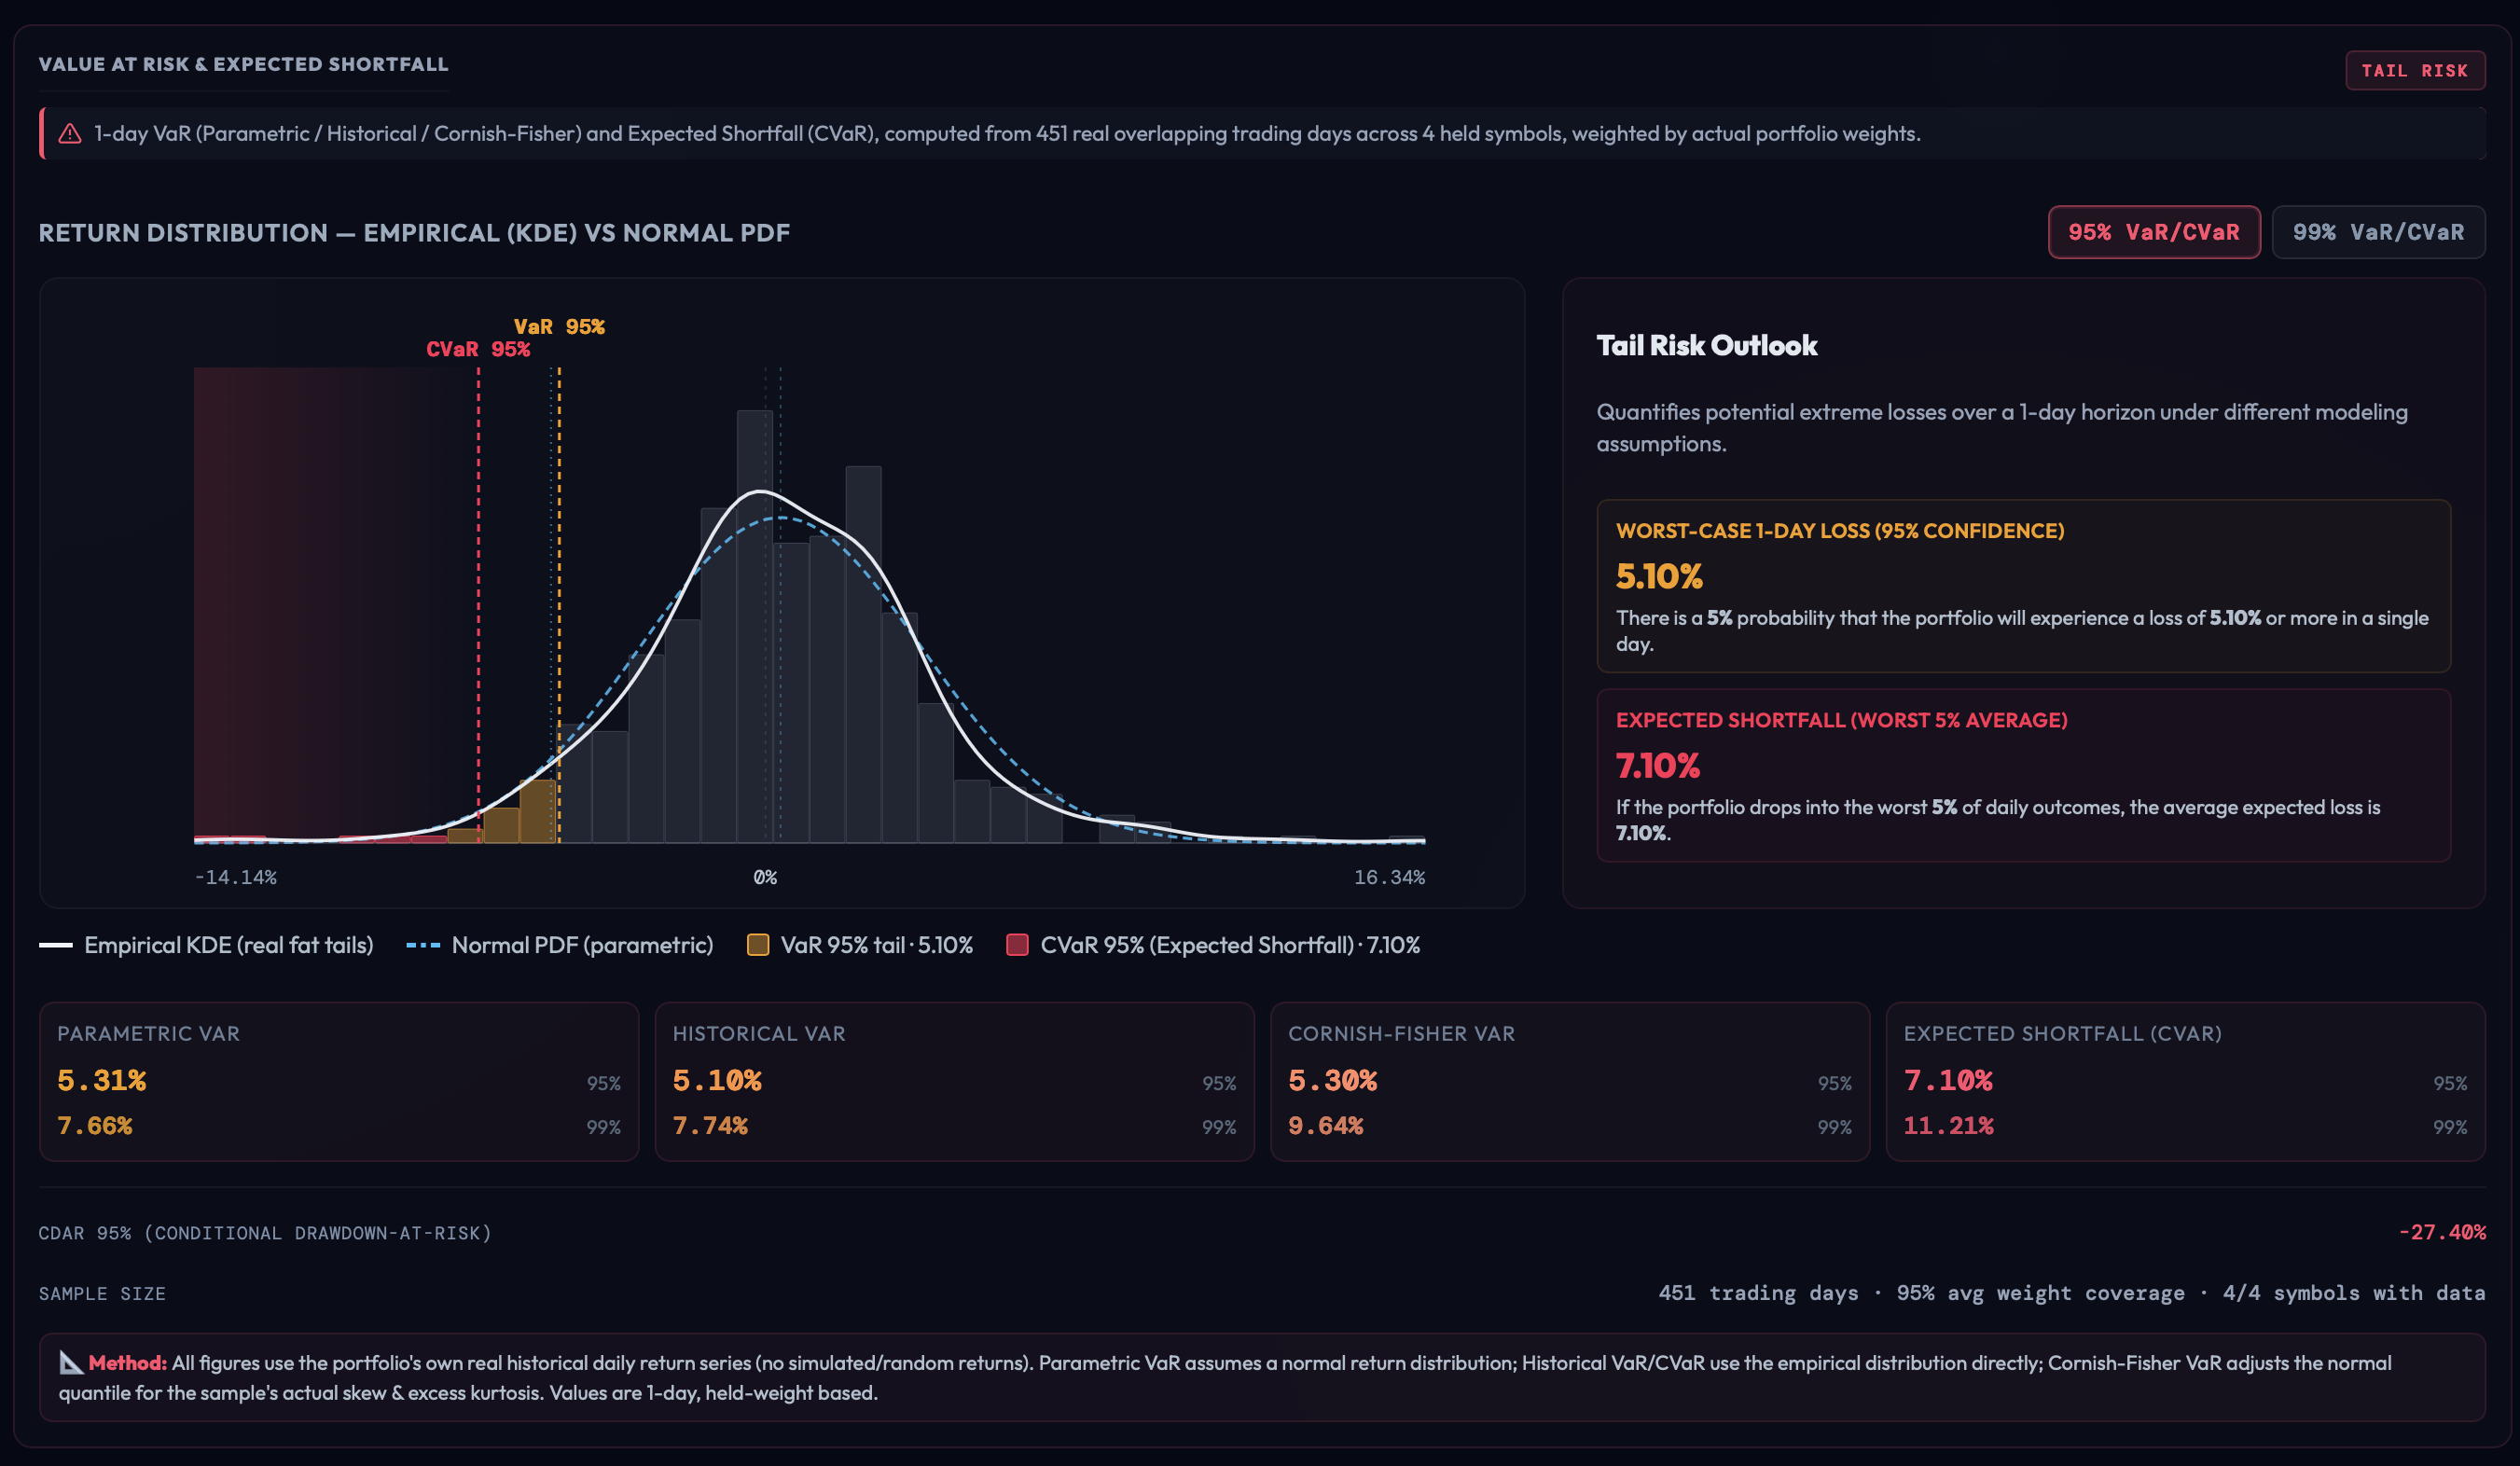
Loving cutting-edge technology doesn’t mean turning a blind eye to the math of risk. The very factor concentration that powers outsized bull-market compounding is the exact same engine that accelerates drawdown velocity when spending cools.
Building the future takes immense courage, whether you're the engineer designing blind-mate manifolds or the investor backing the compute cycle with your own capital. The goal isn't to shy away from high-beta innovation, but to use rigorous quantitative analytics so you understand the tails, manage your drawdown risk, and stay solvent long enough to see the vision materialize.
Reference:
https://www.linkedin.com/feed/update/urn:li:activity:7501751096118476801
Informational only — not financial advice. This digest interprets publicly available information and data for educational purposes and does not constitute a recommendation to buy, sell or hold any financial product. Verify sources and consider your own circumstances before making financial decisions.
- Beyond Traditional Sectors: Why Next-Generation Taxonomy is the Core Engine of Modern Portfolio Construction
- The $17 Million Lookback Trap: What 25 Years of Market Regimes Teach Us About Portfolio Construction
- Master the Mindrative Portfolio Workflow | Next-Gen Quantitative Analy
- Stop Fighting Spreadsheets: Inside the Mindrative Intelligence Terminal
- Navigating the Cross-Asset Matrix: What the Math Tells Us About Late-Cycle Realities and the AI Capex Cycle
- The $17 Million Lookback Trap: What 25 Years of Market Regimes Teach Us About Portfolio Construction