Deciphering Market Structure: Inside the Portfolio AlphaDeck Playbook
How auction profile, institutional cost basis, and volatility metrics reveal what price alone hides.
Peering Beneath the Ticker Tape
Imagine walking into a bustling weekend flea market. Thousands of deals are struck every minute, yet an untrained eye only sees the price tag on the latest antique lamp sold. Was it a bargain, or did the buyer overpay? In modern markets, staring at a simple price chart offers the exact same dilemma. To truly grasp what is happening under the hood, traders turn to quantitative frameworks that break down auction theory, institutional cost basis, and volatility cycles.
Using NVDA as an analytical case study through the lens of Portfolio AlphaDeck, we can explore how multi-horizon data transforms raw price fluctuations into actionable structural clarity.
Figure 1.
1. The AlphaDeck Overview: High-Level Market Bias
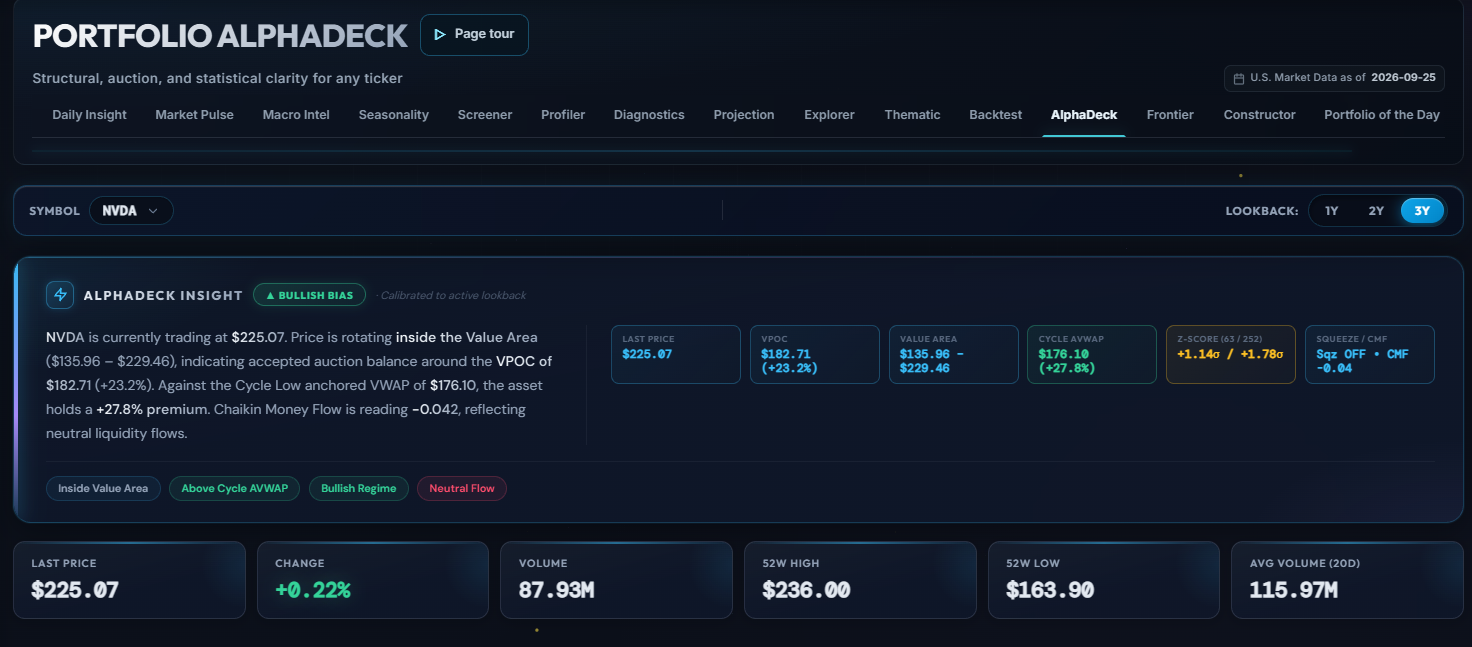
At first glance, the top-level AlphaDeck dashboard synthesizes several core technical regimes to provide an overarching diagnosis. With NVDA trading at $225.07 (up +0.22% for the session against a 52-week range of $163.90 to $236.00), the system flags a Bullish Bias.
Key contextual metrics establish the landscape:
- Value Area Location: The asset is rotating comfortably inside its macro Value Area ($135.96 to $229.46).
- Cycle Low AVWAP Premium: The price commands a +27.8% premium relative to the Cycle Low Anchored VWAP ($176.10).
- Volume and Participation: The session records 87.93M in volume against a 20-day average volume of 115.97M.
Rather than chasing emotion, this regime scorecard confirms that while prices are elevated, they remain within defined structural bounds.
Figure 2.
2. Auction Market Structure: The Busiest Stall in the Bazaar
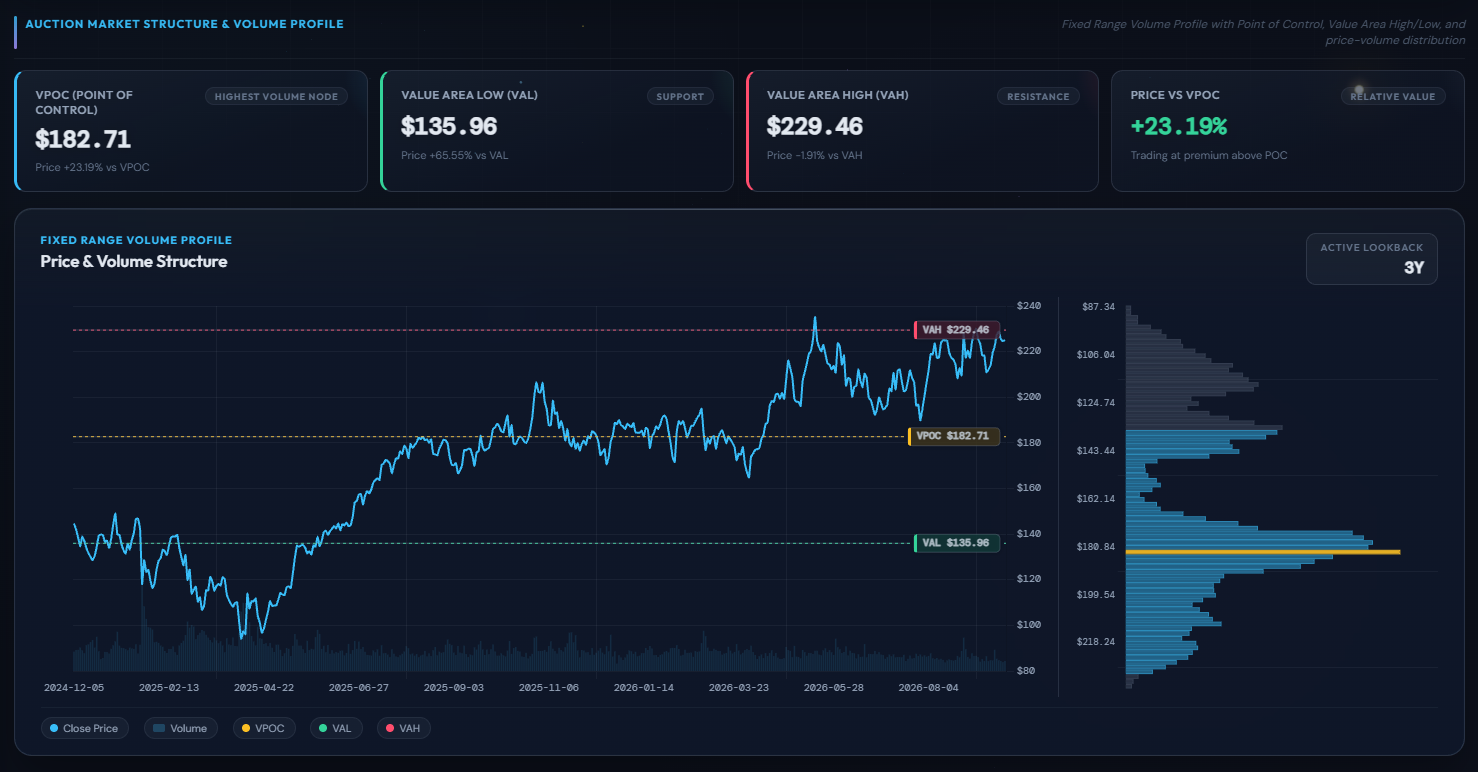
Auction Market Theory views price as an advertising mechanism and volume as the measure of acceptance. Over a 3-year lookback, the Fixed Range Volume Profile illustrates where participants spent the most capital:
- VPOC (Volume Point of Control): Situated at $182.71, this represents the single highest volume node—the heavy magnet where buyers and sellers reached maximum consensus. Currently, price trades at a +23.19% premium above this anchor.
- Value Area Low (VAL): Located at $135.96, serving as foundational multi-year structural support.
- Value Area High (VAH): Positioned at $229.46, sitting just 1.91% above the current price, acting as dynamic overhead resistance.
Figure 3.
3. Institutional Cost Basis: Anchored VWAP Milestones
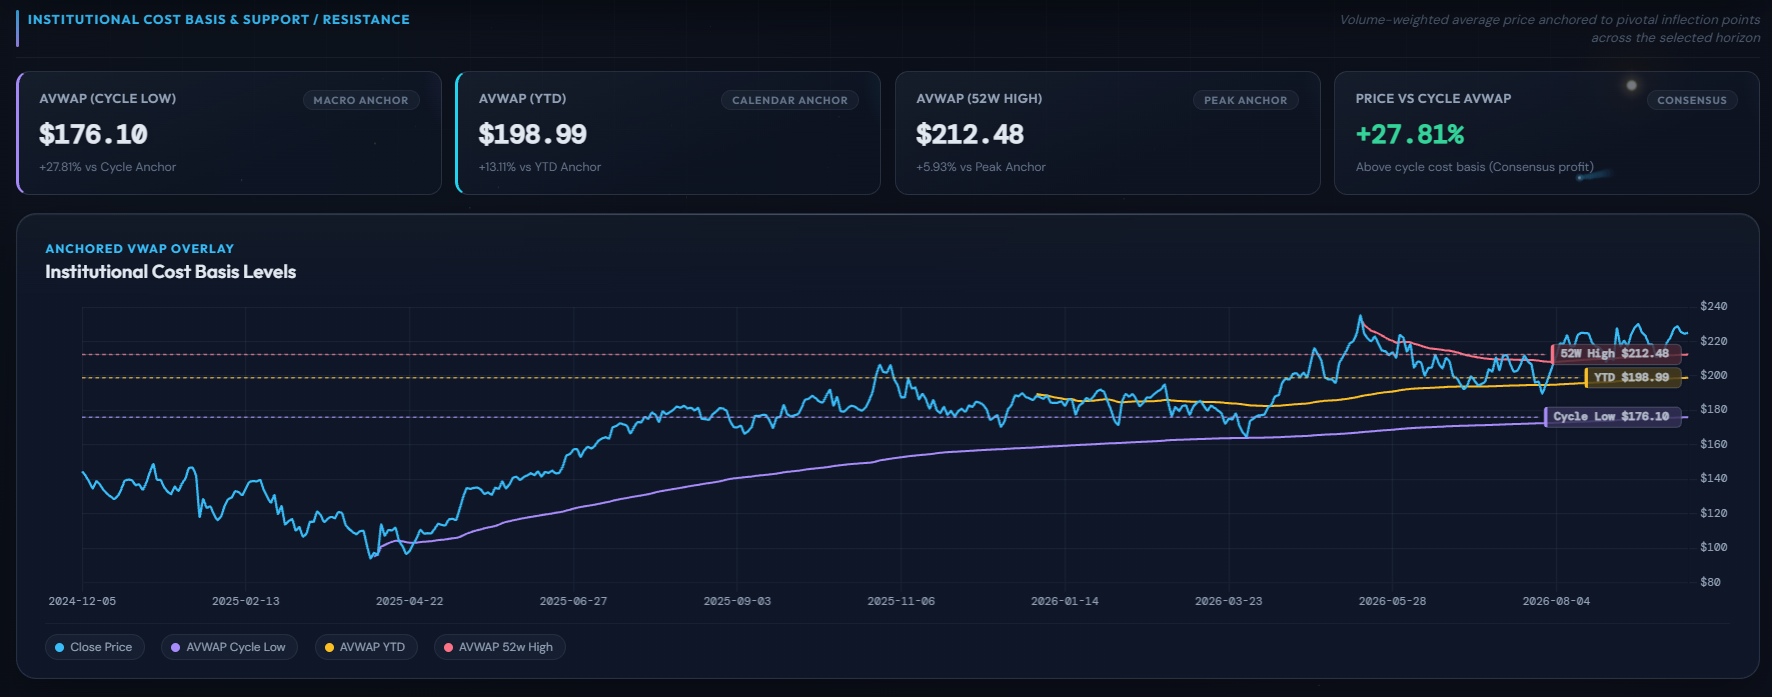
Big institutions don't buy or sell their positions in a single heartbeat; they build inventory across months. Anchored Volume-Weighted Average Price (AVWAP) levels reveal the aggregate cost basis of participants from pivotal market turning points:
- Cycle Low Anchor ($176.10): The long-term macro floor. The current price sits +27.81% above it, indicating that bottom-cycle institutional buyers enjoy strong unrealized gains.
- Calendar Anchor / YTD ($198.99): The benchmark for annual performance, with price maintaining a +13.11% cushion above this level.
- Peak Anchor / 52-Week High ($212.48): The cost basis anchored to the recent peak. Because price trades +5.93% above this mark, even buyers who entered around previous local highs have regained profitability.
When price stacks neatly above its Peak, YTD, and Cycle anchors simultaneously, institutional supply overhang is minimized because virtually every major cohort is sitting on green positions.
Figure 4.
4. Statistical Overextension: Gauging the Mean-Reversion Elastic
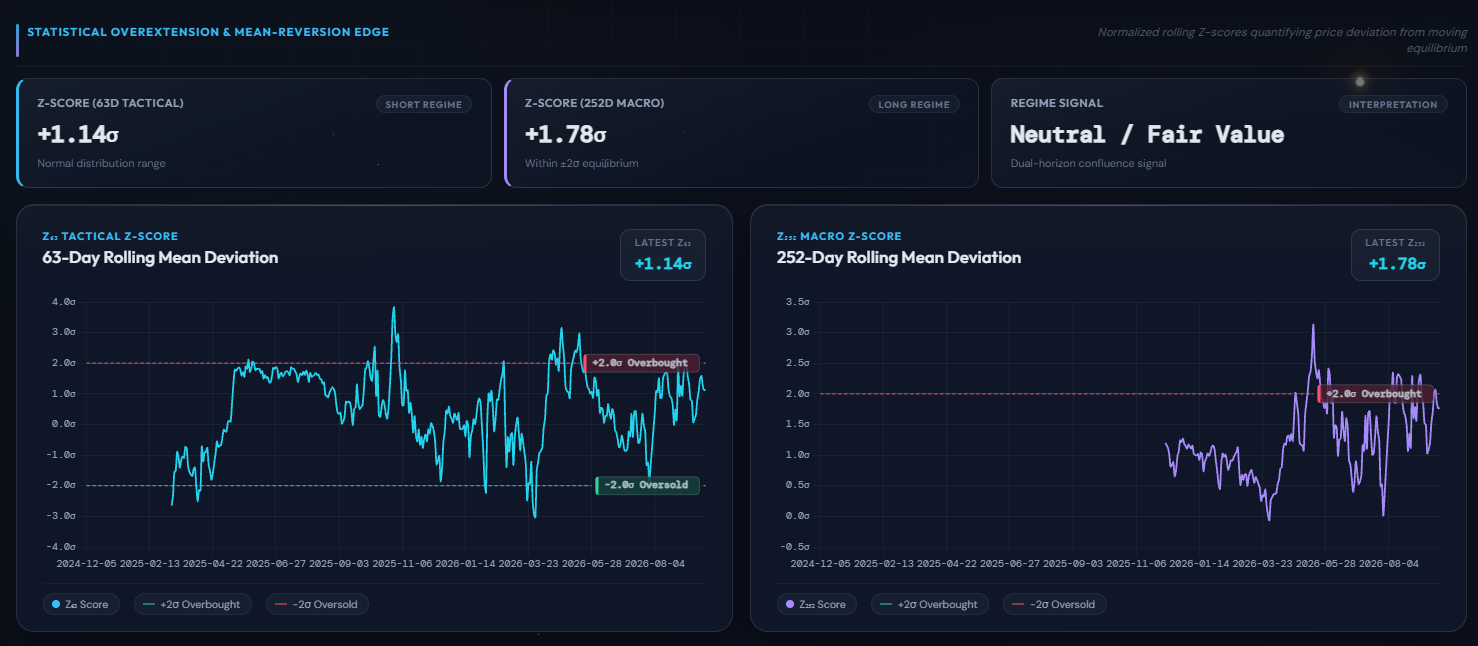
Is the asset overextended? Moving averages alone can be misleading, which is where normalized rolling Z-scores enter the equation. By measuring how many standard deviations (σ) the price deviates from its moving equilibrium, we get an objective view of stretch:
- 63-Day Tactical Z-Score: +1.14σ, comfortably inside the normal distribution zone and well below the +2.0σ overbought barrier.
- 252-Day Macro Z-Score: +1.78σ, reflecting a strong uptrend that approaches but has not crossed the +2.0σ statistical extreme.
The regime signal is interpreted as Neutral / Fair Value on a dual-horizon basis, suggesting that while the market is buoyant, it hasn't stretched the statistical rubber band to an snapping point.
Figure 5.
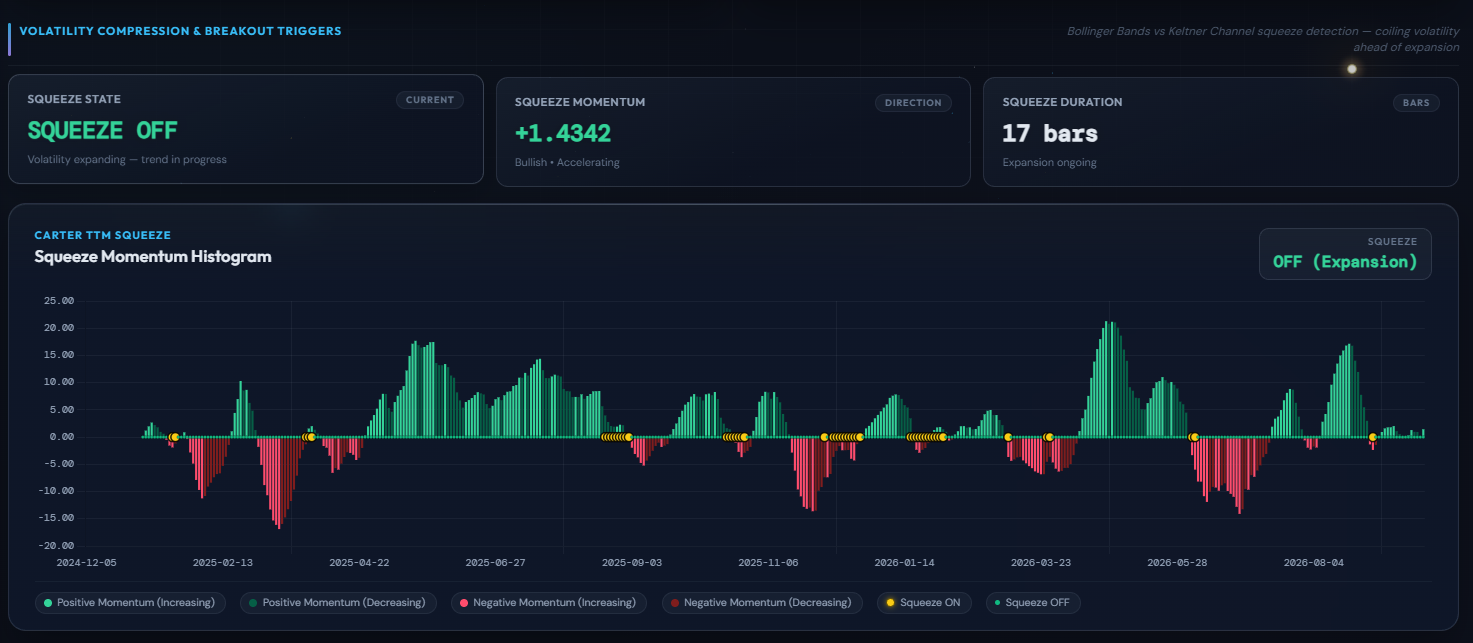
5. Volatility Compression: The Coiled Spring Has Released
Markets oscillate between periods of tight consolidation (compression) and energetic expansion. Using John Carter's classic TTM Squeeze metric—which tracks Bollinger Bands contracting inside Keltner Channels—we can identify momentum breakouts.
The readings indicate:
- Squeeze State: SQUEEZE OFF, confirming that volatility is actively expanding rather than coiling.
- Squeeze Momentum: +1.4342, with a positive, accelerating momentum histogram.
- Duration: 17 bars into the ongoing expansion phase.
Like a compressed spring that has already triggered its release, the current move is actively unfolding rather than idling at rest.
Figure 6.
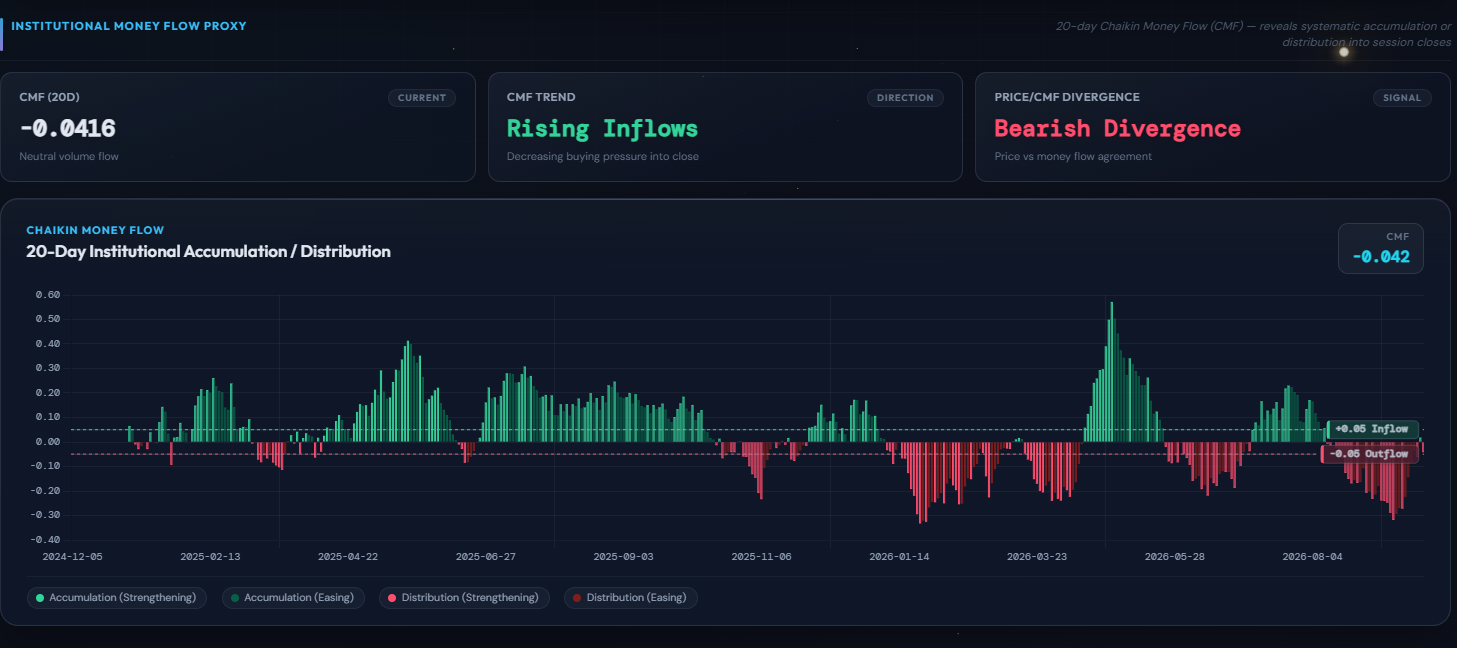
6. Institutional Money Flow: Spotting the Undercurrents
Price action tells you where the ball bounced; money flow reveals who kicked it. The 20-day Chaikin Money Flow (CMF) monitors whether volume is disproportionately concentrated near the top or bottom of session ranges.
Currently, the 20-day CMF reads -0.0416, indicating neutral-to-soft institutional accumulation. More critically, the system flags a Bearish Divergence between price and money flow. Even though price has climbed toward the upper limits of its Value Area near $229.46, underlying volume intensity into the close has softened slightly.
The Big Picture Synthesis
When we assemble each piece of the puzzle, the diagnostic picture comes alive: NVDA exhibits strong structural health, holding comfortably above key institutional anchors ($176.10, $198.99, and $212.48) with expanding upside squeeze momentum. However, with price approaching the $229.46 Value Area High and Chaikin Money Flow signaling a mild divergence, the data advises respecting overhead resistance rather than assuming an unchecked run. By combining auction profile, statistical standard deviations, and institutional flow, traders move beyond guesswork into true structural clarity.
Informational only — not financial advice. This digest interprets publicly available information and data for educational purposes and does not constitute a recommendation to buy, sell or hold any financial product. Verify sources and consider your own circumstances before making financial decisions.
- Navigating the Cross-Asset Matrix: What the Math Tells Us About Late-Cycle Realities and the AI Capex Cycle
- Stop Fighting Spreadsheets: Inside the Mindrative Intelligence Terminal
- Master the Mindrative Portfolio Workflow | Next-Gen Quantitative Analy
- Beyond Traditional Sectors: Why Next-Generation Taxonomy is the Core Engine of Modern Portfolio Construction
- The $17 Million Lookback Trap: What 25 Years of Market Regimes Teach Us About Portfolio Construction