Meta at a Crossroads: Executive Policy Dialogue and Quantitative Trend Indicators
Examining public regulatory discussions alongside rotational momentum and statistical dispersion metrics for Meta.
Public Dialogue on Standards and the Regulatory Backdrop
Navigating the intersection of policy and big tech has become a recurring theme for major digital platforms. Public engagements between industry leaders and political figures often highlight ongoing debates over platform oversight, content moderation guidelines, and uniform regulatory expectations.
A recent public appearance featuring Meta CEO Mark Zuckerberg alongside political figures such as Donald Trump highlighted discussions around setting standards for platforms. While formal legislative mandates remain distinct from general public discourse, dialogue of this nature underscores how platform executives routinely address operational expectations, regulatory frameworks, and governance issues before national audiences.
Evaluating Relative Sector Rotation
Beyond public policy matters, market participants monitor relative performance trends to understand how individual mega-cap equities behave compared to broader market benchmarks like the S&P 500. A common visualization for this dynamic is the Relative Rotation Graph (RRG), which plots relative strength against relative momentum.
Figure 1.
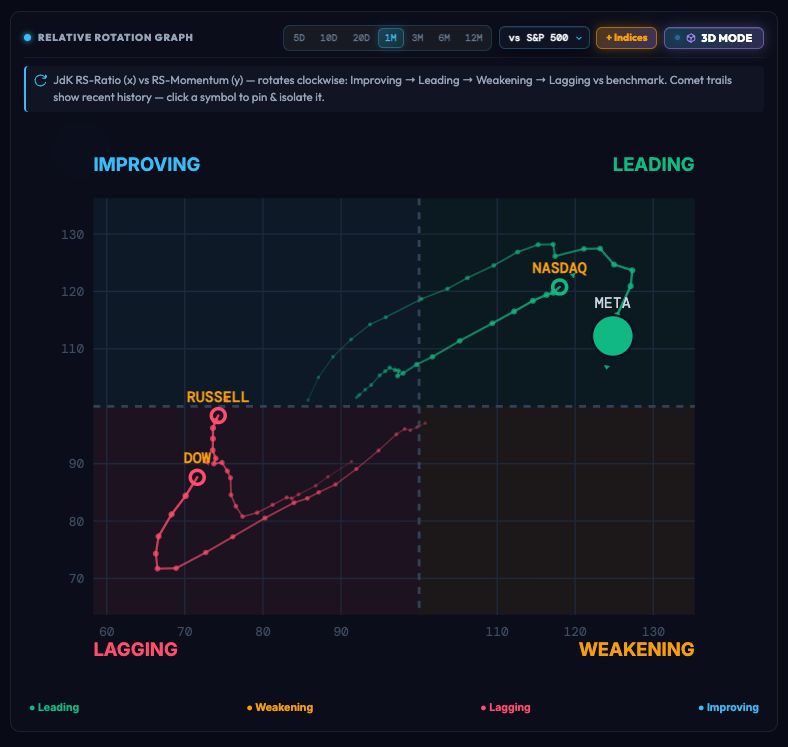
In the rotational model shown above, indices and individual tickers move across four defined quadrants: Improving, Leading, Weakening, and Lagging. While the Nasdaq retains a firm position within the Leading quadrant—reflecting both positive relative strength and upward momentum against the benchmark—Meta illustrates a distinct trajectory. Although Meta’s relative strength ratio remains elevated above 120, its momentum vector has pointed downward toward the Weakening quadrant. Concurrently, broader benchmarks like the Dow and Russell remain situated within the Lagging quadrant, highlighting divergent performance profiles across sectors.
Statistical Overextension Across Tactical and Macro Horizons
To assess whether a sustained move represents balanced trend continuation or price divergence from historical averages, quantitative models frequently track rolling standard deviation metrics, commonly referred to as Z-scores. A Z-score measures how far a current price sits from its rolling mean, normalized by standard deviation.
Figure 2.
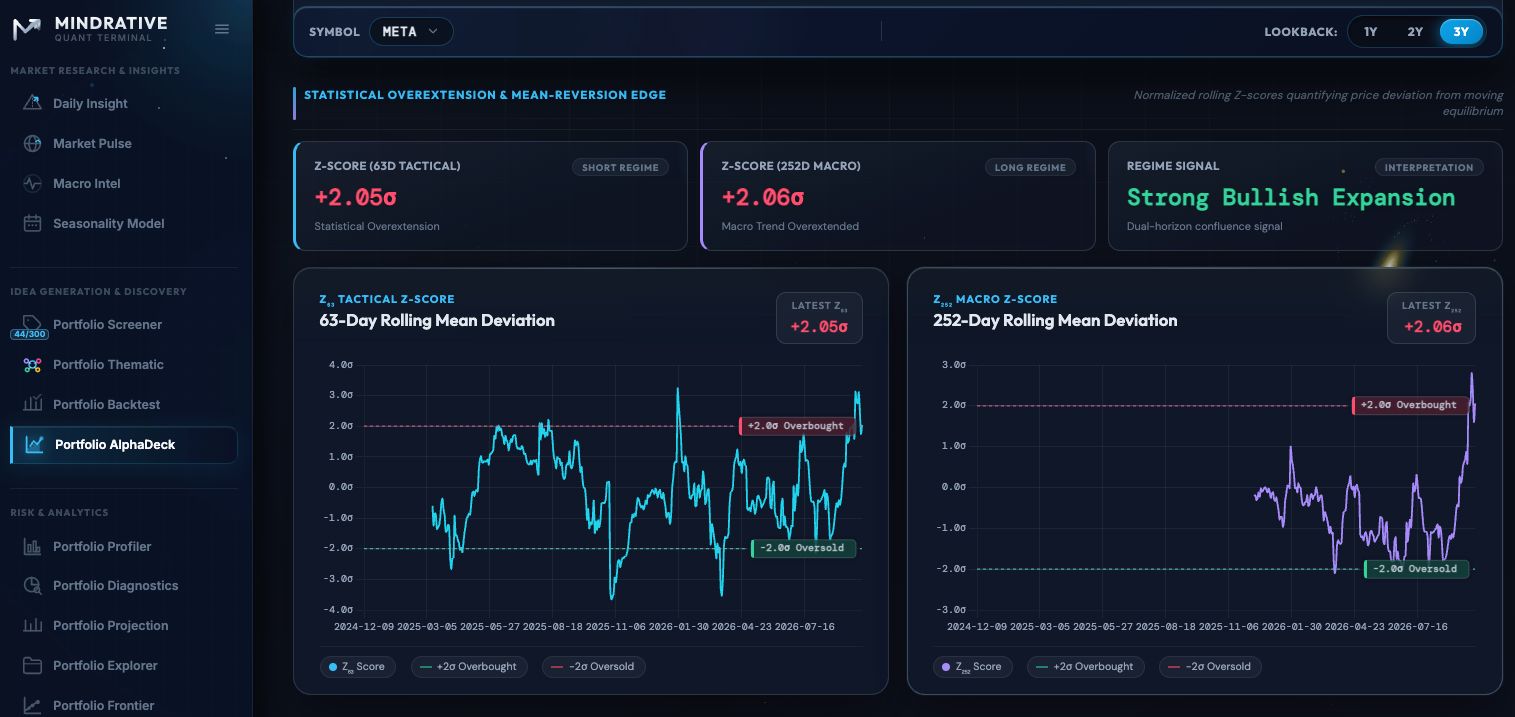
Data from the Mindrative Quant Terminal reveals notable dual-horizon readings for Meta:
- Tactical Z-Score (63-Day Rolling Mean): Registered at +2.05σ, placing short-term price movement above the +2.0σ threshold typically associated with statistical overextension.
- Macro Z-Score (252-Day Rolling Mean): Registered at +2.06σ, similarly demonstrating that longer-term trend performance has reached an upper statistical boundary relative to its 1-year baseline.
- Regime Classification: The confluence across both timeframes triggers a 'Strong Bullish Expansion' label, reflecting extended trend performance over tactical and macro spans.
Interpreting the Evidence
Crossing standard deviation bands does not offer a deterministic directional prediction. An elevated Z-score indicates that price action is significantly higher than its historical rolling average, which statistically marks an overbought condition. However, strong momentum assets can maintain stretched statistical levels for extended periods during prolonged expansions, or consolidate sideways rather than experiencing sharp mean reversion.
When combined with the rotational slowing observed in relative momentum charts, these quantitative metrics illustrate an asset that has experienced substantial capital inflow but is navigating technical extension alongside ongoing scrutiny over platform governance.
Informational only — not financial advice. This digest interprets publicly available information and data for educational purposes and does not constitute a recommendation to buy, sell or hold any financial product. Verify sources and consider your own circumstances before making financial decisions.
- Mindrative Daily News Brief: Tech Capital Moves, Energy Volatility, and Evolving Trade Flows
- Mindrative Daily News Brief After Market: AI Hardware Expansion, Model Safety Progress, and Calmer Stock Futures
- Deciphering Market Structure: Inside the Portfolio AlphaDeck Playbook
- Performance Attribution and Risk Management: A Portfolio Intelligence Review
- Michael Dell, 100 Kilowatts, and a 7.10% Tail: What the Vera Rubin Milestone Teaches Us About Portfolio Risk