Performance Attribution and Risk Management: A Portfolio Intelligence Review
Evaluating a $397K portfolio’s 17.47% YTD surge against upcoming macro catalysts and sector concentration.
Current Portfolio Snapshot
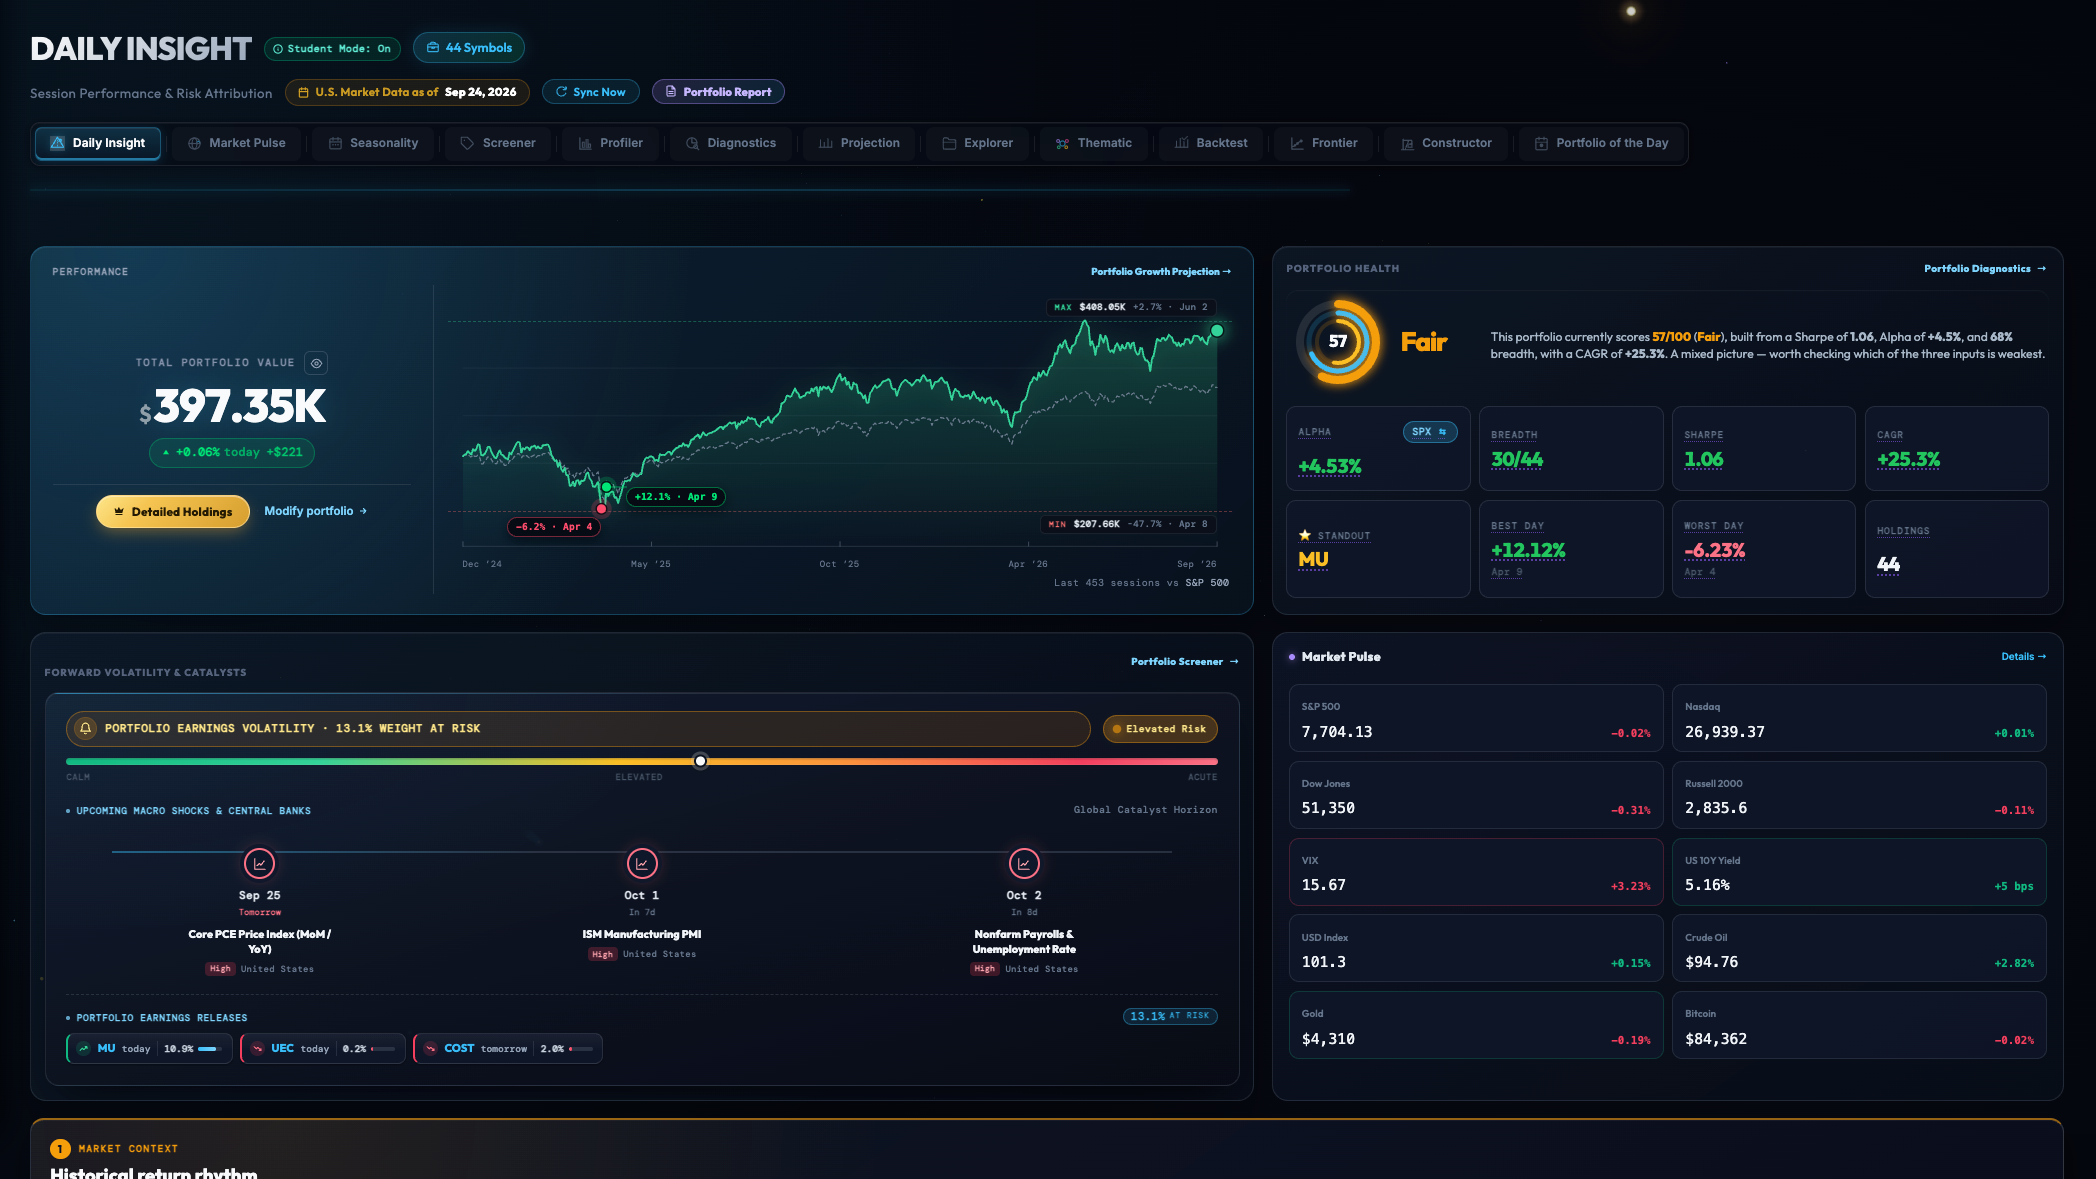
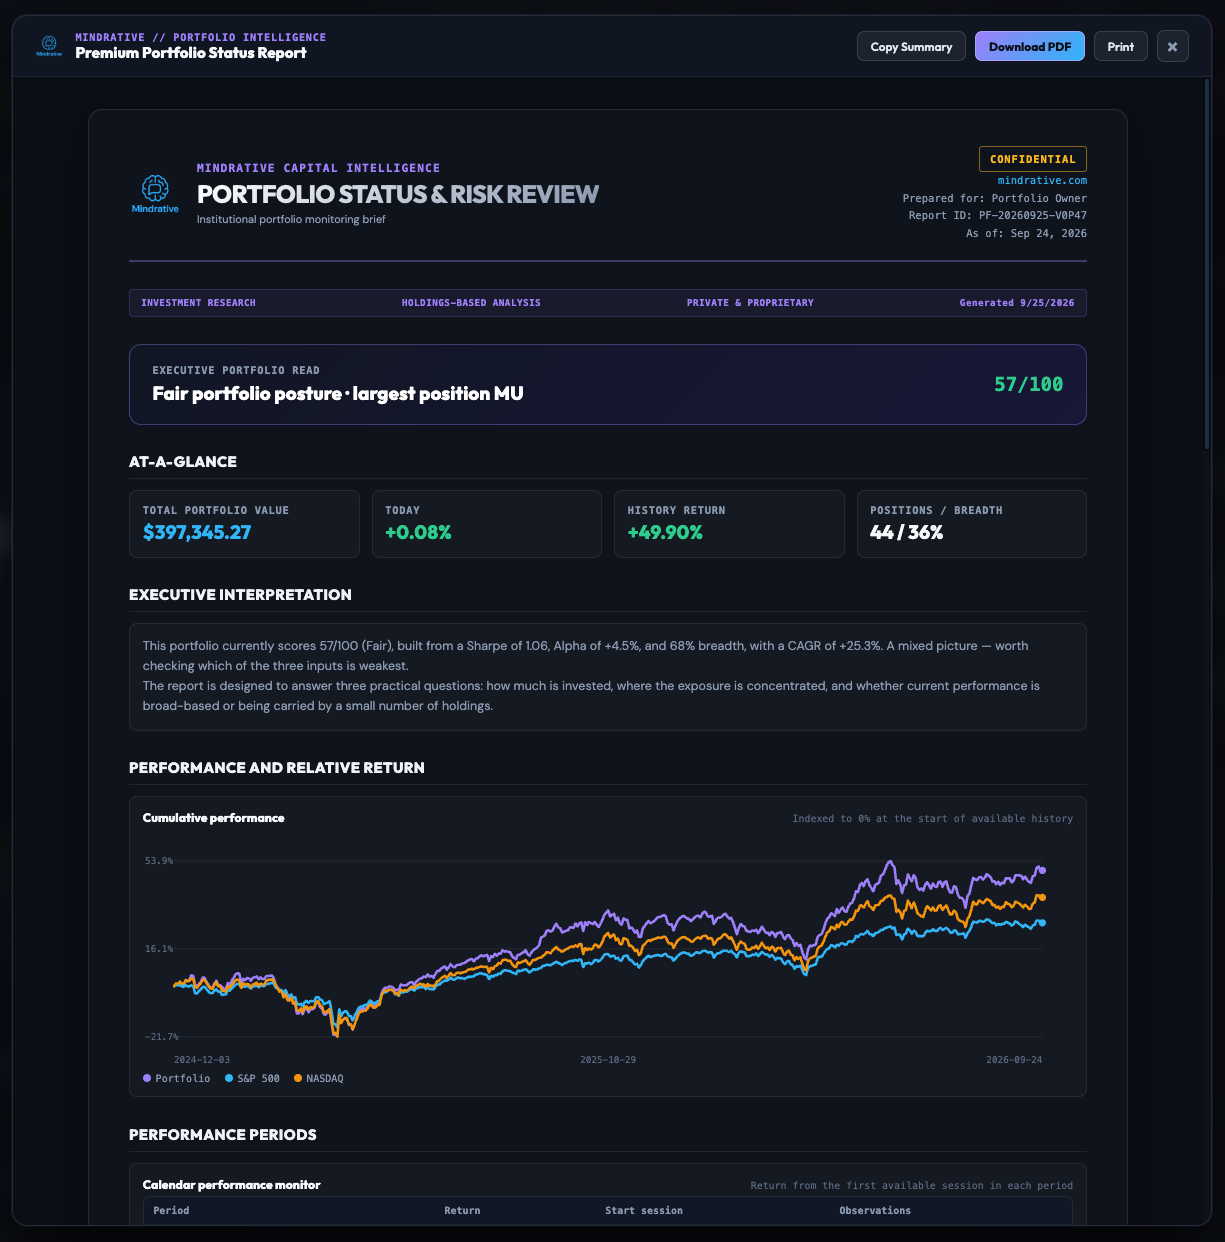
As of September 24, 2026, the portfolio under review maintains a total value of $397,345.27, reflecting a modest daily gain of 0.06%. The system assigns a health score of 57/100, categorized as "Fair." This score is derived from a Sharpe ratio of 1.06 and an Alpha of +4.53%, suggesting that while the portfolio is outperforming the benchmark, there are areas of potential weakness in its breadth or risk distribution. With a Compound Annual Growth Rate (CAGR) of +25.3%, the strategy demonstrates strong historical momentum despite current market fluctuations.
Figure 1.
Quantifying Performance and Breadth
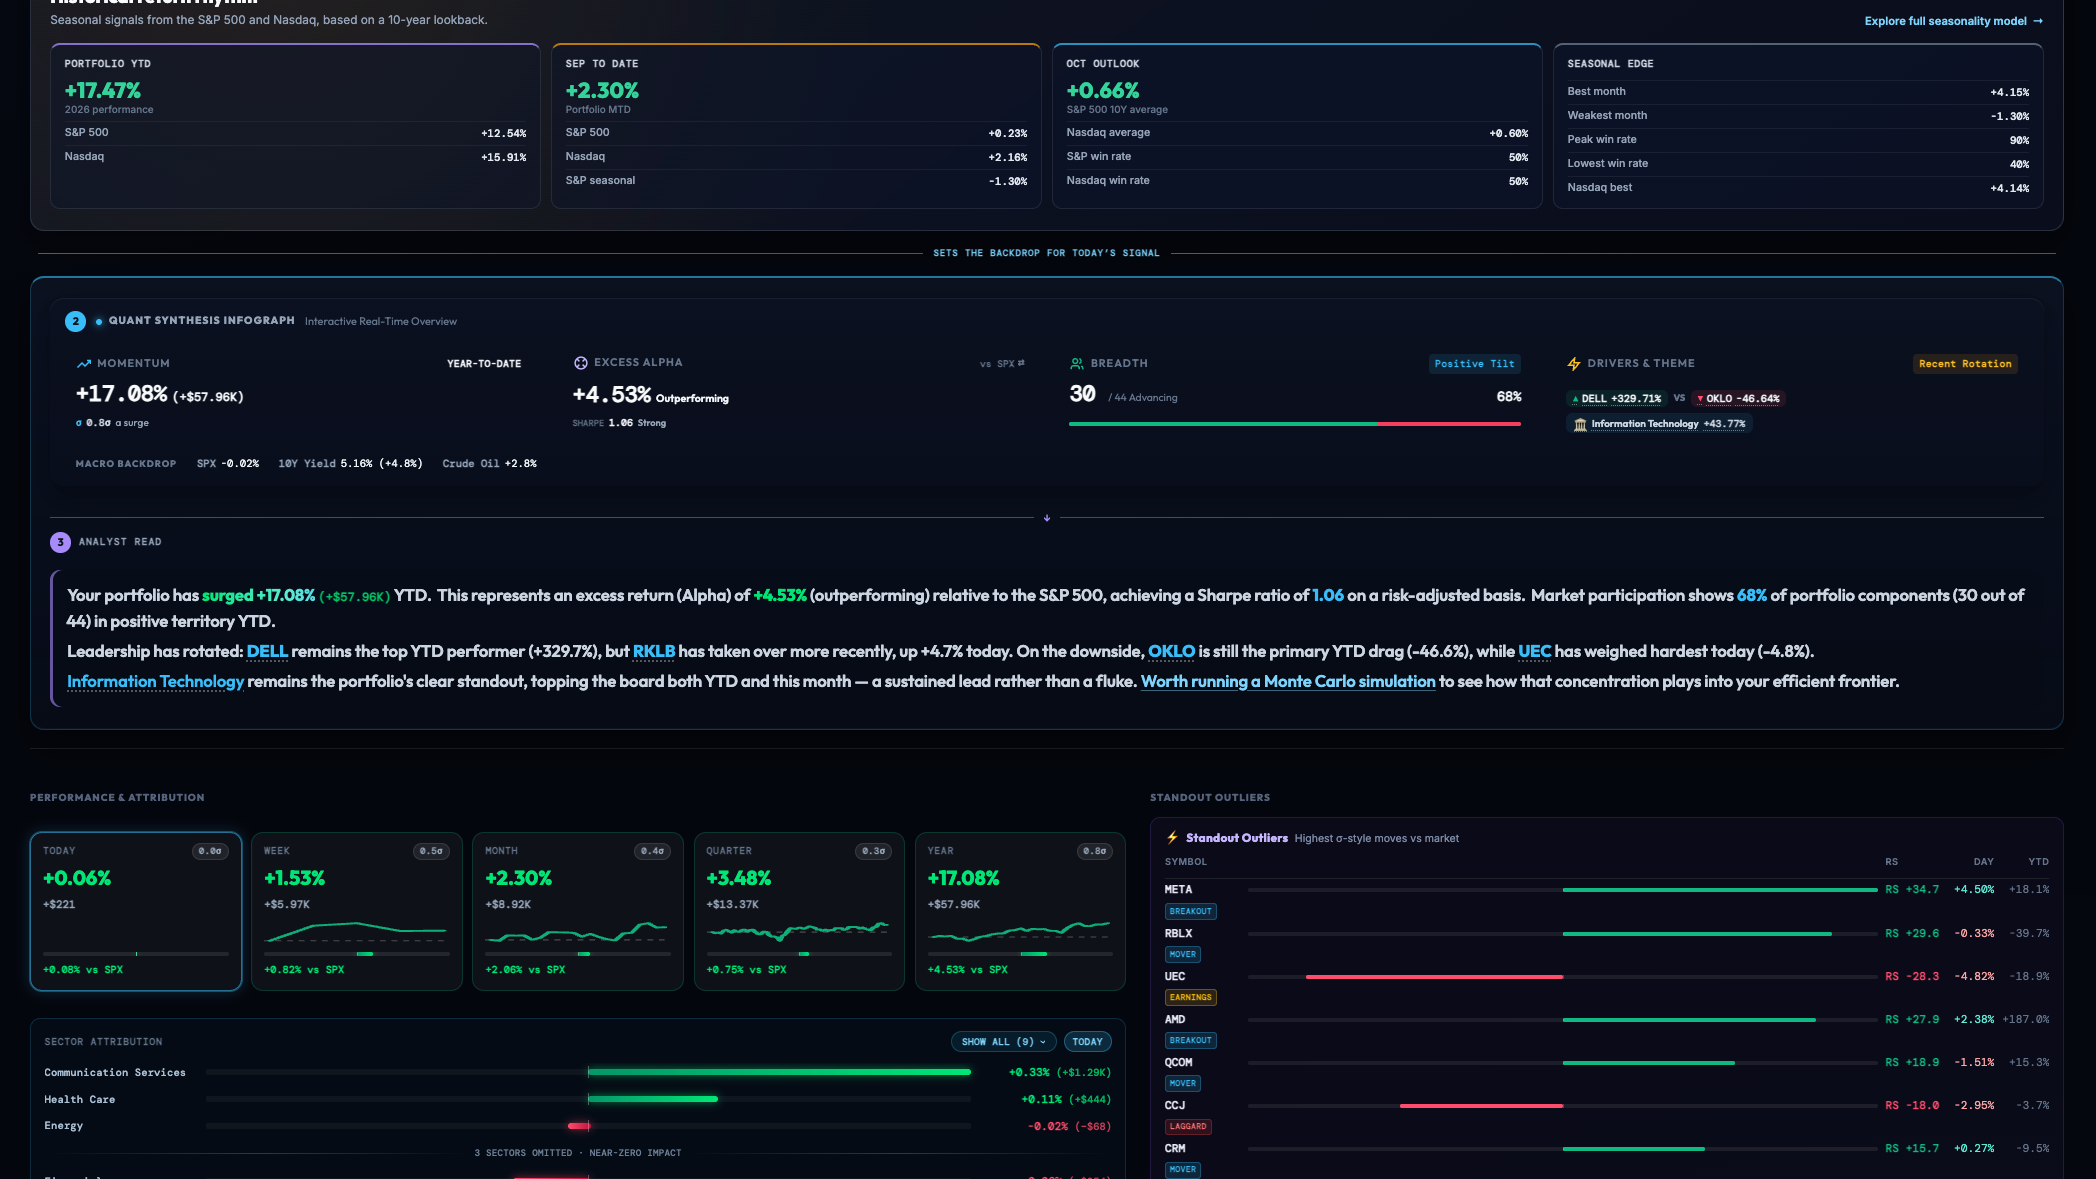
The portfolio has achieved a Year-to-Date (YTD) return of +17.47%, significantly outperforming the S&P 500's +12.54% and the Nasdaq's +15.91% over the same period. This outperformance is driven by a "Positive Tilt" in market participation, with 30 out of 44 holdings (68%) advancing. However, the concentration of gains is notable; DELL remains the top YTD performer with a staggering +329.7% return, while OKLO serves as the primary drag at -46.64%. Information Technology continues to be the dominant sector, providing a sustained lead rather than a temporary fluke.
Figure 2.
Daily Dynamics and Sector Exposure
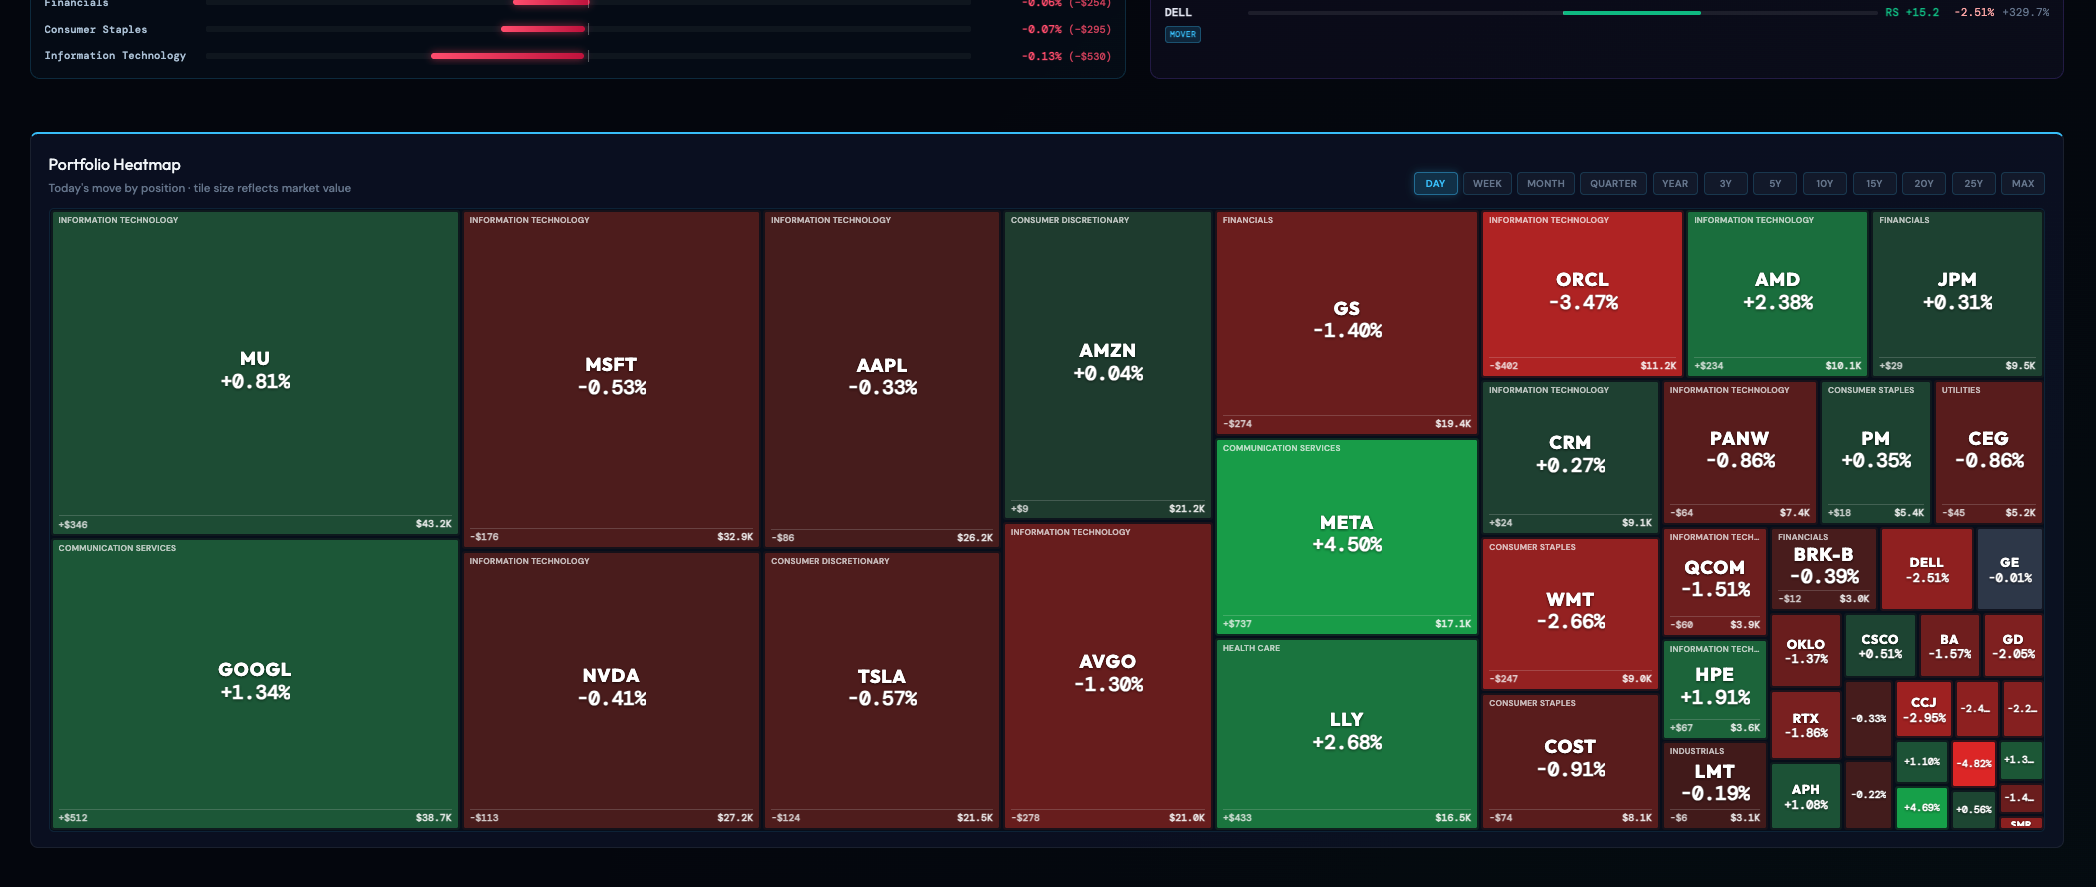
A closer look at the daily heatmap reveals a mixed performance across major holdings. Micron Technology (MU), the portfolio's largest position, saw a gain of +0.81%, while Meta Platforms (META) surged by +4.50%. Conversely, several mega-cap tech stocks experienced slight pullbacks, including Microsoft (MSFT) at -0.53% and Nvidia (NVDA) at -0.41%. The heatmap highlights the heavy weighting in Information Technology and Communication Services, which collectively dictate much of the portfolio's daily volatility.
Figure 3.
Detailed Holdings and Year-to-Date Trends
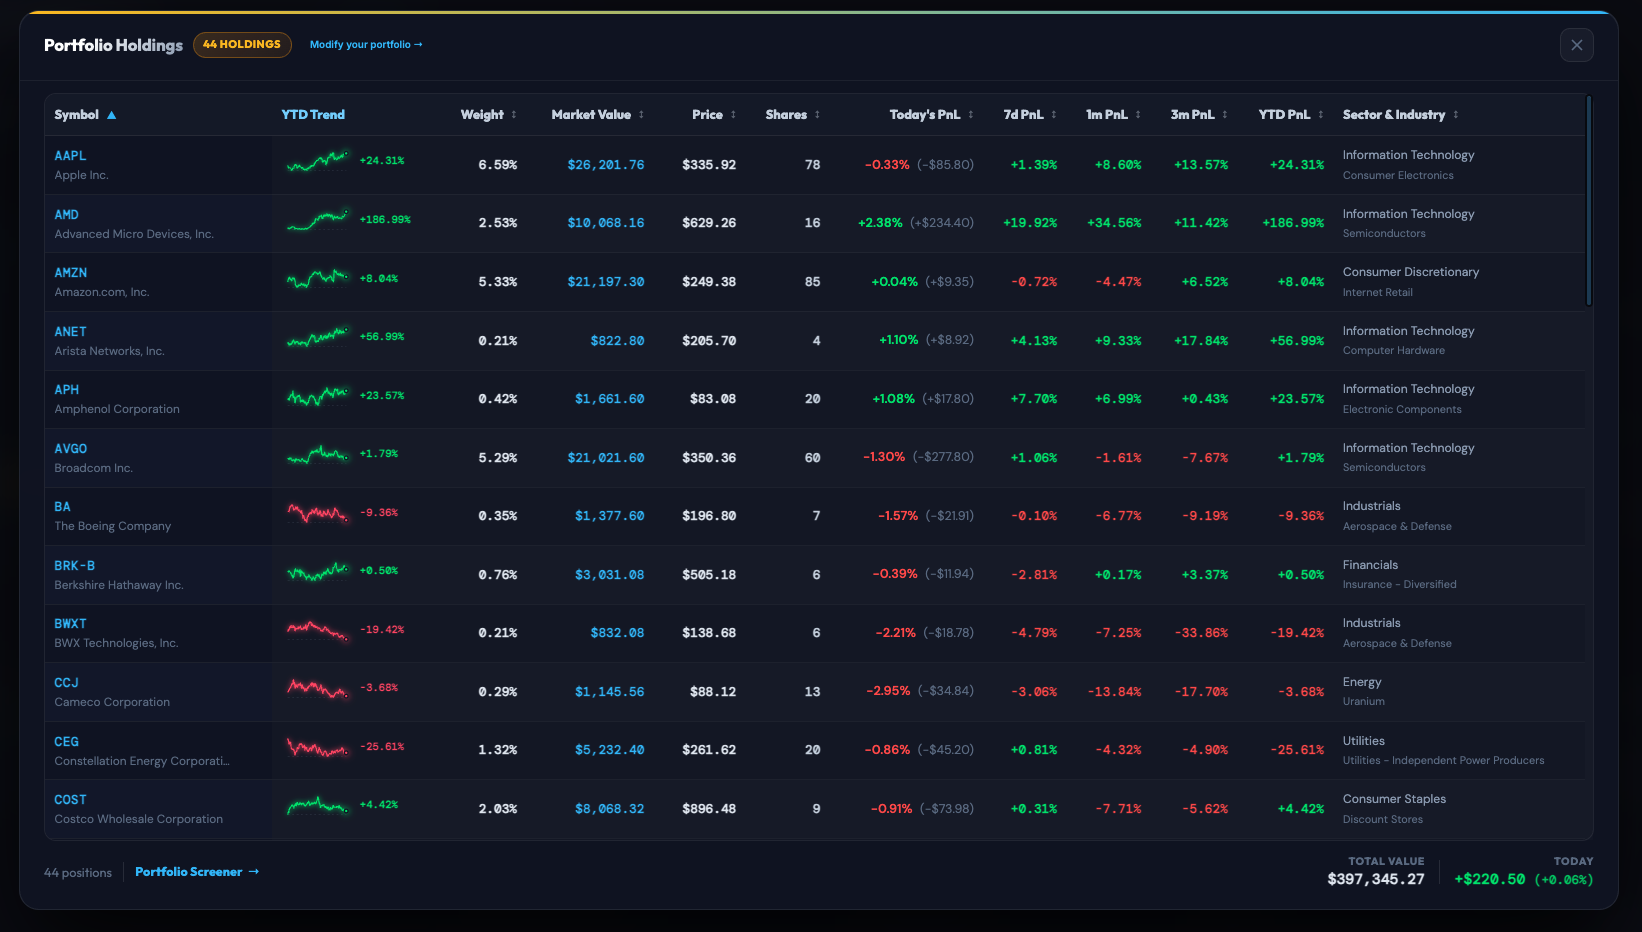
The portfolio consists of 44 distinct holdings with varying degrees of impact. Apple (AAPL) represents the individual weight at 6.59%, showing a solid YTD trend of +24.31%. Other significant contributors include Advanced Micro Devices (AMD), which has climbed +186.99% YTD. On the downside, the portfolio faces challenges from the aerospace and utilities sectors, with Boeing (BA) down -9.36% and Constellation Energy (CEG) dropping -25.61% YTD. This divergence underscores the importance of the "Fair" health rating, as performance is heavily reliant on a subset of high-performing technology stocks.
Figure 4.
The Power of Long-Term Compounding
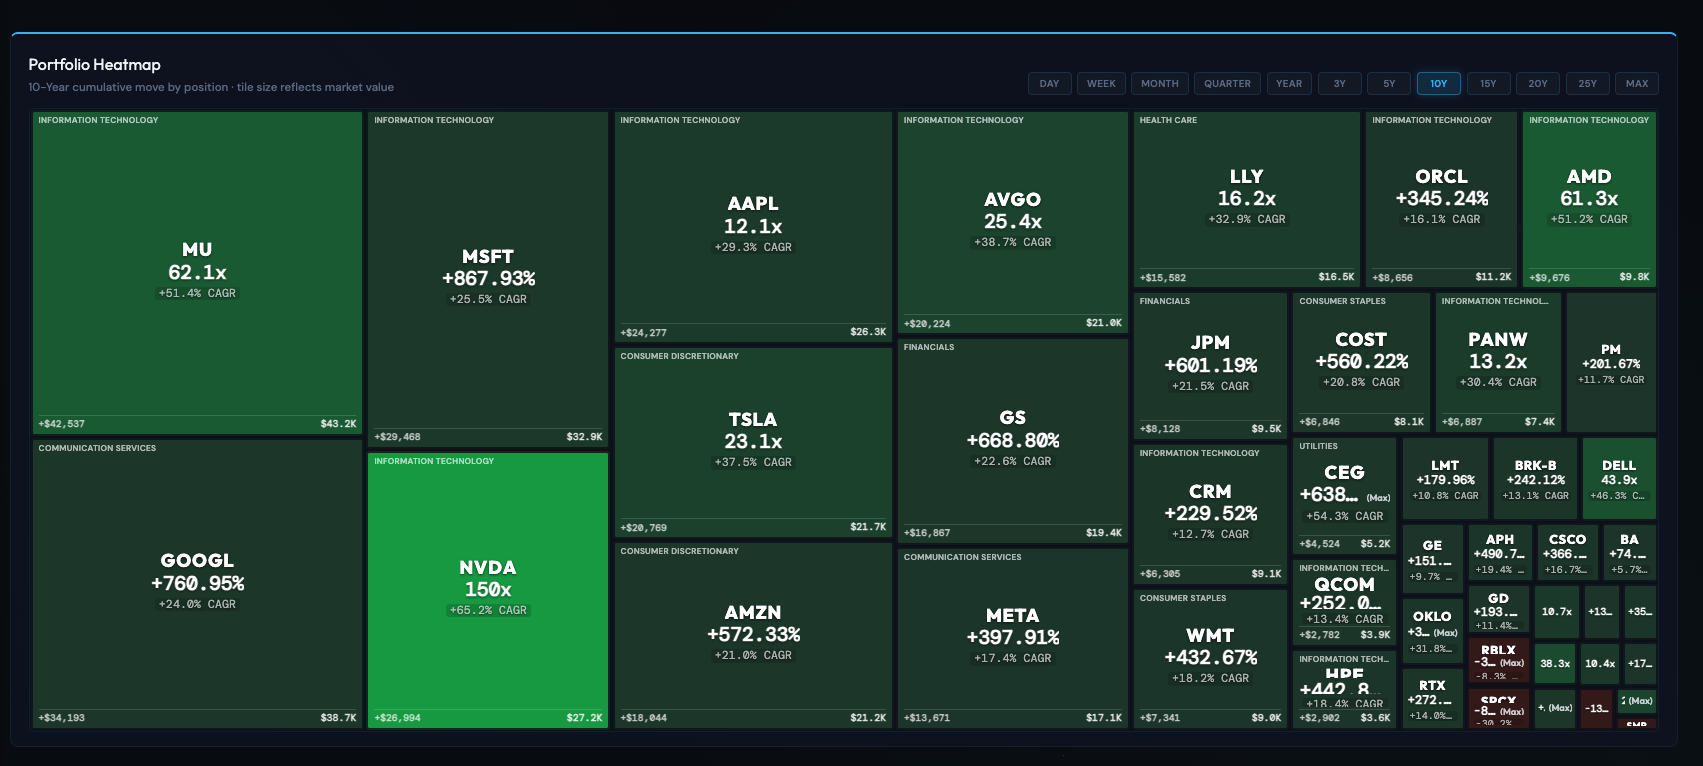
When viewed through a 10-year lens, the cumulative moves of the current holdings are extraordinary. Nvidia (NVDA) leads the pack with a 150x return, followed by Micron (MU) at 62.1x and Microsoft (MSFT) at +867.93%. These figures illustrate the long-term efficacy of the selected core positions, particularly within the semiconductor and software industries. The 10-year cumulative heatmap serves as a reminder that while short-term volatility is present, the portfolio's foundation is built on historically high-growth assets.
Figure 5.
Executive Summary and Risk Outlook
The Premium Portfolio Status Report confirms a total historical return of +49.90% since inception. Looking ahead, the "Global Catalyst Horizon" identifies several high-impact macro events that could introduce volatility. These include the Core PCE Price Index release on September 25, the ISM Manufacturing PMI on October 1, and the Nonfarm Payrolls report on October 2. With 13.1% of the portfolio weight currently at risk due to upcoming earnings volatility, particularly in stocks like Costco (COST) and Micron (MU), maintaining a vigilant stance on risk attribution remains critical.
The report is designed to answer three practical questions: how much is invested, where the exposure is concentrated, and whether current performance is broad-based or being carried by a small number of holdings.
Figure 6.
Informational only — not financial advice. This digest interprets publicly available information and data for educational purposes and does not constitute a recommendation to buy, sell or hold any financial product. Verify sources and consider your own circumstances before making financial decisions.
- Michael Dell, 100 Kilowatts, and a 7.10% Tail: What the Vera Rubin Milestone Teaches Us About Portfolio Risk
- The $17 Million Lookback Trap: What 25 Years of Market Regimes Teach Us About Portfolio Construction
- Beyond Traditional Sectors: Why Next-Generation Taxonomy is the Core Engine of Modern Portfolio Construction
- The $17 Million Lookback Trap: What 25 Years of Market Regimes Teach Us About Portfolio Construction
- Master the Mindrative Portfolio Workflow | Next-Gen Quantitative Analy