
Mapping the AI Supply Chain: Infrastructure Constraints for a 100,000-GPU Cluster
Interactive modeling reveals how memory stacks, advanced packaging, and grid access dictate the real limits of frontier AI hardware.
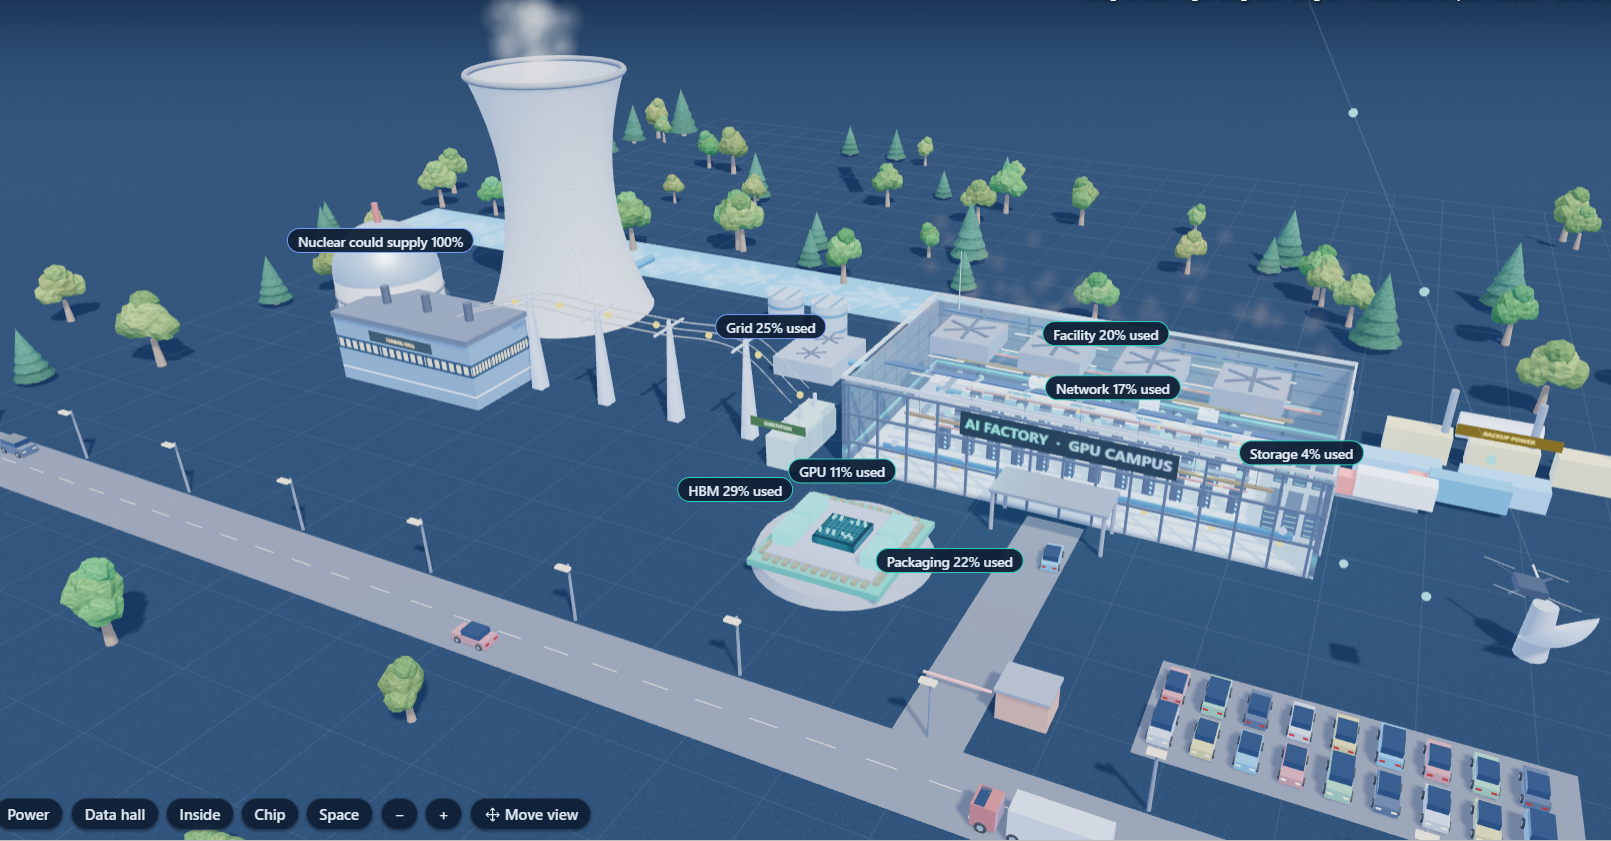
💡 Explore the Data Live: Want to test your own cluster assumptions? Adjust GPU counts, stress-test power grids, and simulate supply-chain bottlenecks across memory, packaging, and optical fabrics in real time using the Interactive AI Stack Bottleneck Explorer.
Tracing the Physical Limits of Artificial Intelligence
When discussions turn to frontier artificial intelligence, conversation usually centers on algorithms, token counts, and parameter scale. Yet every digital advancement ultimately depends on physical infrastructure: raw silicon, high-voltage transformers, fiber-optic transceivers, and gigawatt-scale electricity. A detailed interactive supply chain model highlights what it physically takes to assemble a single large-scale training cluster of 100,000 graphics processing units (GPUs) under present-day supply conditions.
Figure 1.

At a baseline setting of 100,000 GPUs, the model calculates a continuous power draw of roughly 140 megawatts (MW). For perspective, that is comparable to the electricity demands of a mid-sized city. The immediate takeaway from the cluster-level dashboard is feasibility: building a single training facility of this magnitude today is technically achievable without completely breaking worldwide manufacturing capacity. However, headroom varies dramatically across inputs, with High Bandwidth Memory (HBM) identified as the tightest constraint, absorbing an estimated 29% of available supply.
The Broader Lifecycle: From Minerals to Applications
Scaling frontier AI is not merely about procuring finished chips; it requires an interconnected chain of upstream extraction, fabrication, network provisioning, and capital deployment.
Figure 2.
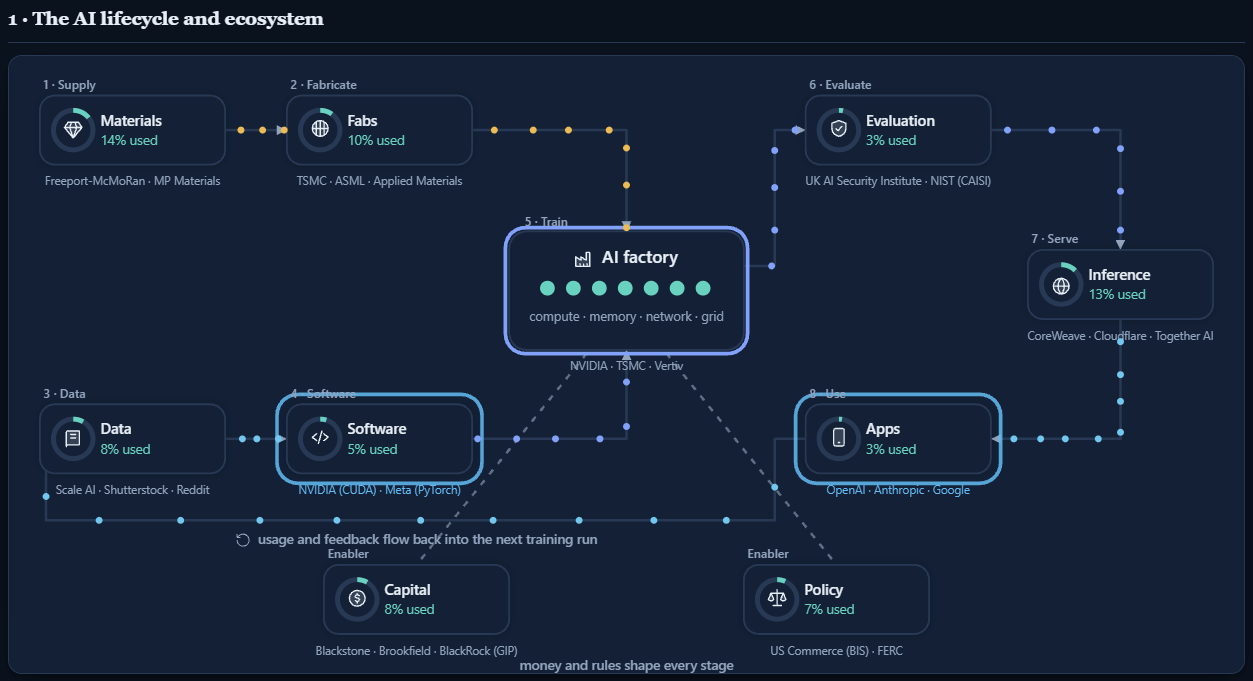
The interactive dashboard structures the artificial intelligence ecosystem into eight distinct operational phases, supported by regulatory and financial enablers:
- Upstream Supply and Fabrication: Raw materials (accounting for 14% of available sector capacity in this scenario, tied to producers like Freeport-McMoRan and MP Materials) feed into semiconductor fabrication facilities (10% capacity utilization across vendors such as TSMC, ASML, and Applied Materials).
- Data and Software: Pre-training assets from repositories and data aggregators (8% utilized) work alongside foundational software libraries and frameworks (5% utilized), such as NVIDIA's CUDA and Meta's PyTorch.
- The AI Factory: The central hub where compute, high-speed memory, fabric networking, and power infrastructure converge.
- Evaluation, Serving, and End Use: Output weights pass through safety evaluation regimes (3% utilized), into distributed inference infrastructure (13% utilized, involving providers like CoreWeave, Cloudflare, and Together AI), before reaching consumer and enterprise software applications (3% utilized).
- Systemic Enablers: Underpinning every stage are massive capital commitments (8% utilized from private equity and infrastructure asset managers like Blackstone, Brookfield, and BlackRock) and energy-telecom regulatory oversight (7% utilized, notably the U.S. Bureau of Industry and Security and the Federal Energy Regulatory Commission).
Inside the AI Factory: Power and Thermal Bottlenecks
Stepping inside the datacenter compound reveals where regional infrastructure meets high-density compute. As clusters approach the 140 MW threshold, electrical delivery quickly becomes a dominant operational hurdle.
Figure 3.
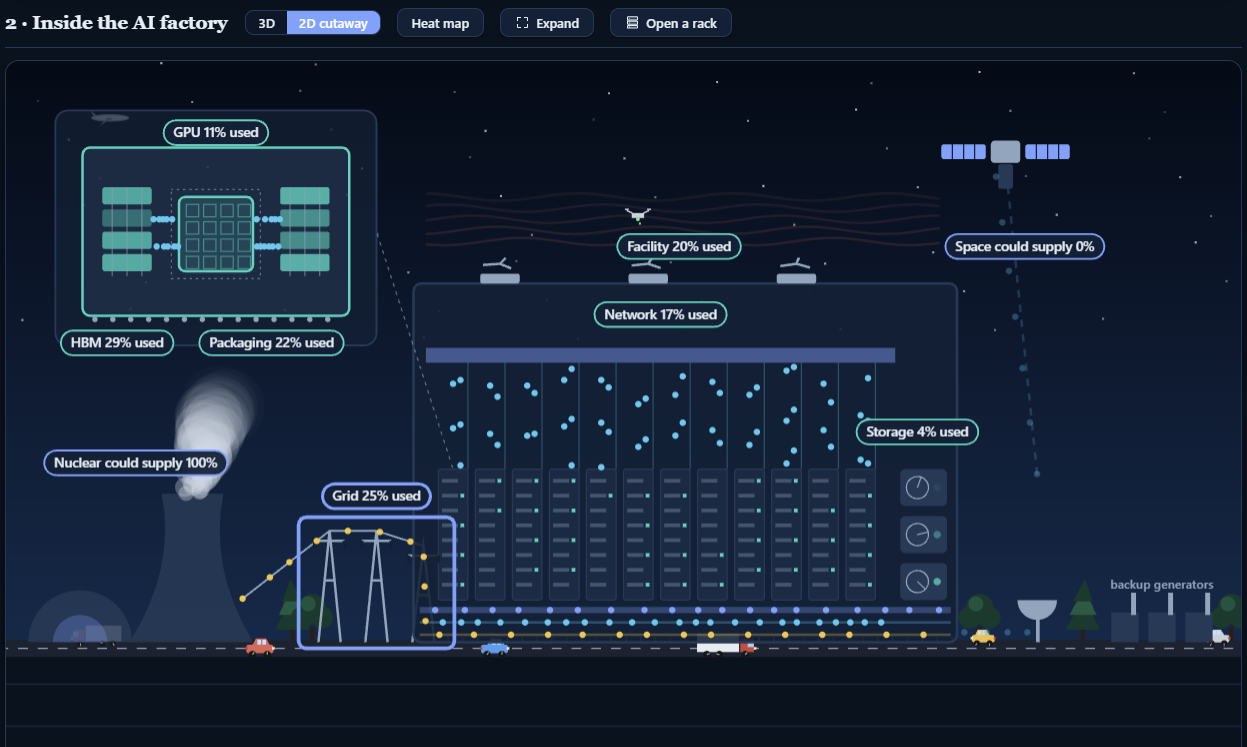
The facility-level model examines power sourcing, structural networking, and thermal loads. While existing regional electrical grids can theoretically accommodate the 25% load allocated in this simulation, datacenters face strict interconnection delays. The dashboard highlights that dedicated zero-carbon baseloads—such as colocation near nuclear power plants—could hypothetically supply up to 100% of required power, whereas speculative orbital solar options remain at 0% practical contribution. Meanwhile, datacenter building facilities absorb 20% of specialized facility capacity, networking backbones require 17%, and dedicated fast-tier storage accounts for 4%.
Dissecting the Rack: Where Components Face Scarcity
To understand why memory represents the closest single limit, one has to examine the server rack architecture. The simulation benchmarks against a high-density liquid-cooled rack standard (comparable to the NVLink-based NVL72 architecture), where each individual cabinet bundles 72 GPUs, 36 CPUs, and dissipates approximately 120 kilowatts (kW) of heat.
Figure 4.
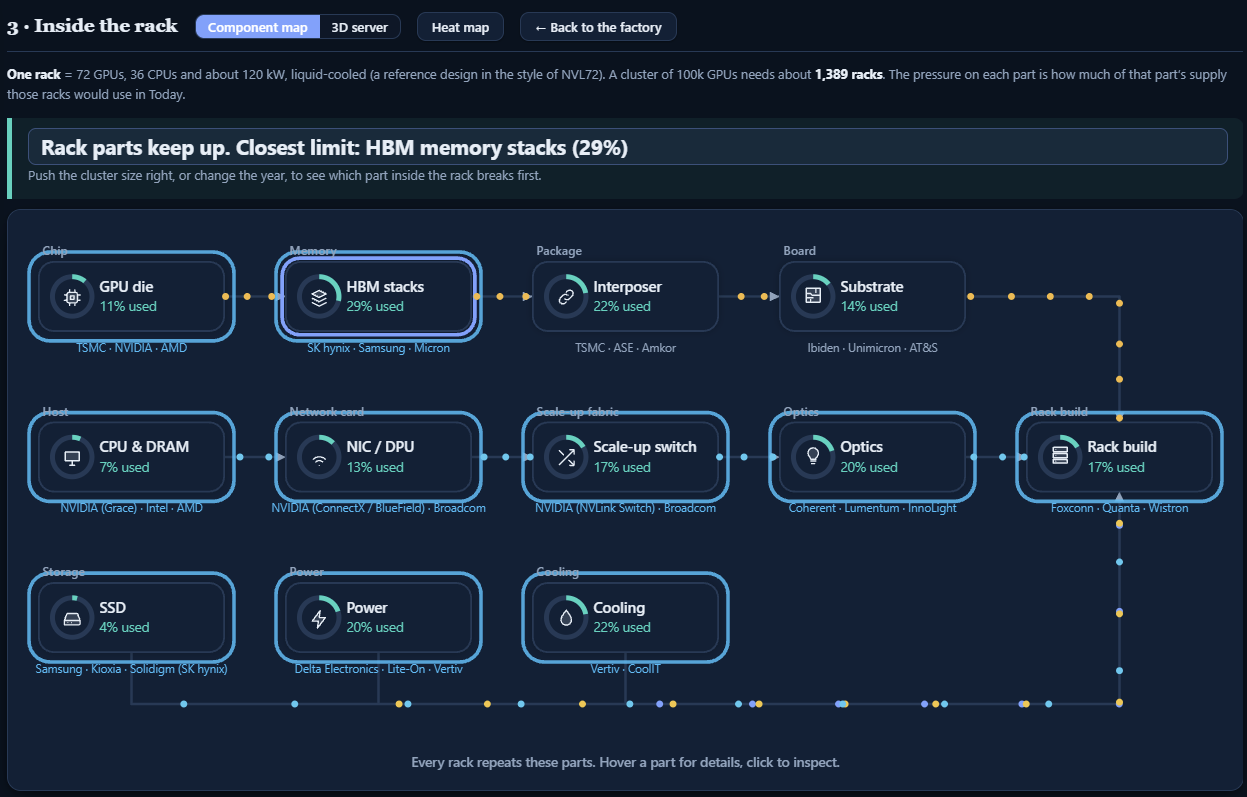
Deploying 100,000 GPUs requires roughly 1,389 of these ultra-dense racks. Distributing that hardware across worldwide component capacity illustrates where supply chains face friction:
- High Bandwidth Memory (29% used): Staked memory dies supplied by SK hynix, Samsung, and Micron face the highest percentage draw of any single component. High Bandwidth Memory stacks multiple dynamic RAM (DRAM) dies vertically through microscopic copper connections, making it both technically complex and slow to yield at scale.
- Advanced Packaging and Interposers (22% used): Placing GPU dies directly adjacent to memory requires silicon interposers and specialized packaging processes handled by companies like TSMC, ASE, and Amkor.
- Power and Cooling Subsystems (20% and 22% used): Transitioning 120 kW per rack from air cooling to closed-loop liquid cold plates and distribution units requires significant output from cooling specialists such as Vertiv and CoolIT, alongside power distribution units from suppliers like Delta Electronics and Lite-On.
- Optical Transceivers and Scale-Up Switching (20% and 17% used): Linking thousands of GPUs into a single logical computer demands vast optical fabric networks (involving Coherent, Lumentum, and InnoLight) and specialized switching silicon.
- Core Processing Dies and Motherboards: By comparison, raw GPU die manufacturing sits at 11% capacity utilization, while printed circuit board substrates take up 14%, and host server CPUs combined with standard system DRAM take up just 7%.
Understanding the Analytical Model and Its Boundaries
This model offers a valuable structural view of technology dependencies, but several context-dependent factors warrant attention. The calculations represent an isolated snapshot of supply availability at current baseline volumes. In a real-world scenario, simultaneous construction of several 100k-GPU clusters by competing hyperscalers would aggregate these percentages rapidly, multiplying procurement bottlenecks.
Furthermore, supplier capacity is not static. Memory manufacturers and advanced packaging foundries continue to expand cleanroom floor space and capital expenditures. While High Bandwidth Memory and 2.5D packaging represent the tightest operational limits for building large clusters today, the balance between chip production, electrical interconnection approvals, and specialized liquid cooling components will continue to shift as datacenter scale expands toward the gigawatt era.
Informational only — not financial advice. This digest interprets publicly available information and data for educational purposes and does not constitute a recommendation to buy, sell or hold any financial product. Verify sources and consider your own circumstances before making financial decisions.
References & Further Reading
- Mindrative Daily Intelligence Brief: Monetary Policy Trajectory, Executive Succession Dynamics, and Energy Transition Re
- Meta at a Crossroads: Executive Policy Dialogue and Quantitative Trend Indicators
- Deciphering Market Structure: Inside the Portfolio AlphaDeck Playbook
- Performance Attribution and Risk Management: A Portfolio Intelligence Review
- Michael Dell, 100 Kilowatts, and a 7.10% Tail: What the Vera Rubin Milestone Teaches Us About Portfolio Risk